

Patrones actuales

Los patrones son modelos gráficos que se forman en el gráfico mediante el precio. Según uno de los postulados del análisis técnico, la historia (movimiento del precio) se repite. Esto quiere decir que los movimientos del precio a menudo son similares en las mismas situaciones que hacen posible pronosticar el futuro desarrollo de la situación con una alta probabilidad.
Los patrones relevantes de InstaTrade son un servicio fácil de utilizar que permiten que conozca los últimos cambios en el mercado y reaccione a las pistas del mercado a tiempo. En nuestro servicio, siempre encontrará los últimos y más importantes patrones en cualquier par y en cualquier marco de tiempo.
Double Bottom
was formed on 07.04 at 13:00:00 (UTC+0)
signal strength 4 of 5
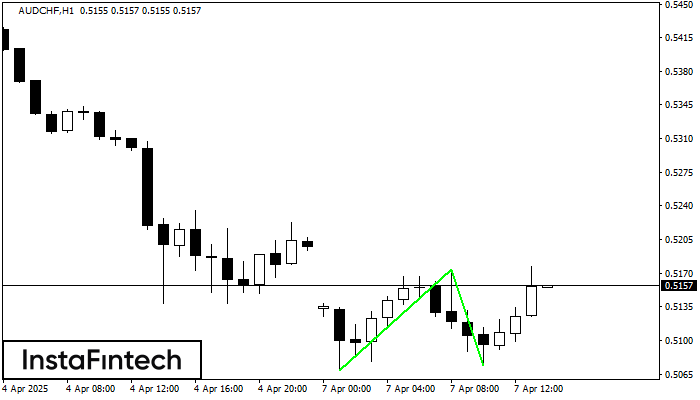
The Double Bottom pattern has been formed on AUDCHF H1; the upper boundary is 0.5174; the lower boundary is 0.5074. The width of the pattern is 105 points. In case of a break of the upper boundary 0.5174, a change in the trend can be predicted where the width of the pattern will coincide with the distance to a possible take profit level.
Vea asimismo
- All
- All
- Bearish Rectangle
- Bearish Symmetrical Triangle
- Bearish Symmetrical Triangle
- Bullish Rectangle
- Double Top
- Double Top
- Triple Bottom
- Triple Bottom
- Triple Top
- Triple Top
- All
- All
- Buy
- Sale
- All
- 1
- 2
- 3
- 4
- 5
Rectángulo Bajista
was formed on 23.05 at 23:00:20 (UTC+0)
signal strength 1 of 5

Según el gráfico de M5, EURNZD formó el Rectángulo Bajista. El patrón indica la continuación de una tendencia. El límite superior es 1.8982, el límite inferior es 1.8964. La señal
Los marcos de tiempo M5 y M15 pueden tener más puntos de entrada falsos.
Open chart in a new window
Triángulo Simétrico Alcista
was formed on 23.05 at 22:14:53 (UTC+0)
signal strength 1 of 5

Según el gráfico de M5, AUDCHF formó el patrón Triángulo Simétrico Alcista. Descripción: Este es el patrón de la continuación de una tendencia. 0.5335 y 0.5329 son las coordenadas
Los marcos de tiempo M5 y M15 pueden tener más puntos de entrada falsos.
Open chart in a new window
Triángulo Simétrico Alcista
was formed on 23.05 at 22:10:58 (UTC+0)
signal strength 1 of 5

Según el gráfico de M5, AUDJPY formó el patrón Triángulo Simétrico Alcista. Descripción: Este es el patrón de la continuación de una tendencia. 92.60 y 92.44 son las coordenadas
Los marcos de tiempo M5 y M15 pueden tener más puntos de entrada falsos.
Open chart in a new window


