

Patrones actuales

Los patrones son modelos gráficos que se forman en el gráfico mediante el precio. Según uno de los postulados del análisis técnico, la historia (movimiento del precio) se repite. Esto quiere decir que los movimientos del precio a menudo son similares en las mismas situaciones que hacen posible pronosticar el futuro desarrollo de la situación con una alta probabilidad.
Los patrones relevantes de InstaTrade son un servicio fácil de utilizar que permiten que conozca los últimos cambios en el mercado y reaccione a las pistas del mercado a tiempo. En nuestro servicio, siempre encontrará los últimos y más importantes patrones en cualquier par y en cualquier marco de tiempo.
Double Bottom
was formed on 07.04 at 10:29:41 (UTC+0)
signal strength 3 of 5
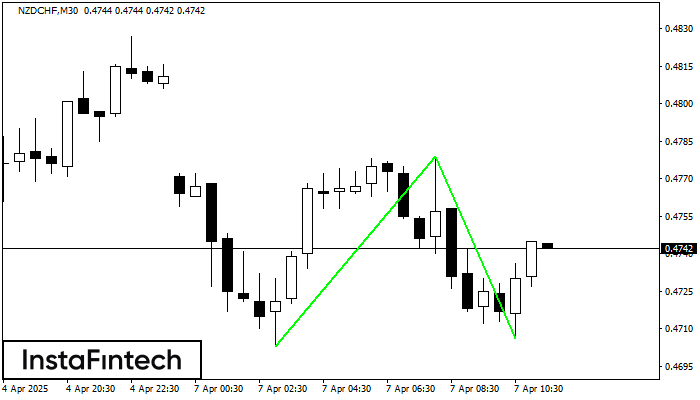
The Double Bottom pattern has been formed on NZDCHF M30. This formation signals a reversal of the trend from downwards to upwards. The signal is that a buy trade should be opened after the upper boundary of the pattern 0.4779 is broken. The further movements will rely on the width of the current pattern 76 points.
- All
- All
- Bearish Rectangle
- Bearish Symmetrical Triangle
- Bearish Symmetrical Triangle
- Bullish Rectangle
- Double Top
- Double Top
- Triple Bottom
- Triple Bottom
- Triple Top
- Triple Top
- All
- All
- Buy
- Sale
- All
- 1
- 2
- 3
- 4
- 5
Bullish Flag
was formed on 21.05 at 18:45:20 (UTC+0)
signal strength 2 of 5

The Bullish Flag pattern which signals continuation of a trend has been formed on the chart AUDUSD M15. Forecast: if the price breaks above the pattern high at 0.6470, then
The M5 and M15 time frames may have more false entry points.
Open chart in a new window
Bullish pennant
was formed on 21.05 at 18:45:15 (UTC+0)
signal strength 2 of 5
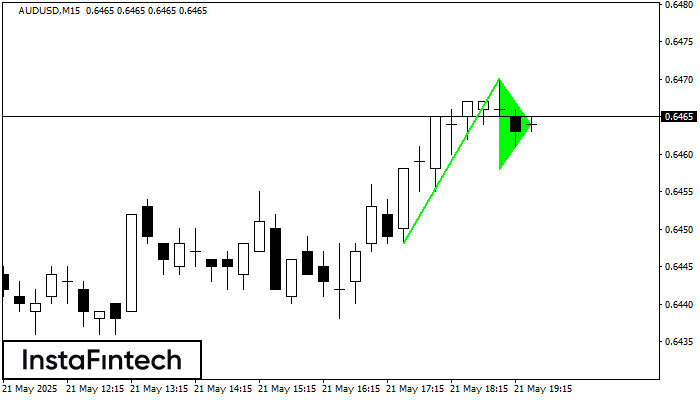
The Bullish pennant signal – Trading instrument AUDUSD M15, continuation pattern. Forecast: it is possible to set up a buy position above the pattern’s high of 0.6470, with the prospect
The M5 and M15 time frames may have more false entry points.
Open chart in a new window
Double Top
was formed on 21.05 at 18:30:12 (UTC+0)
signal strength 1 of 5
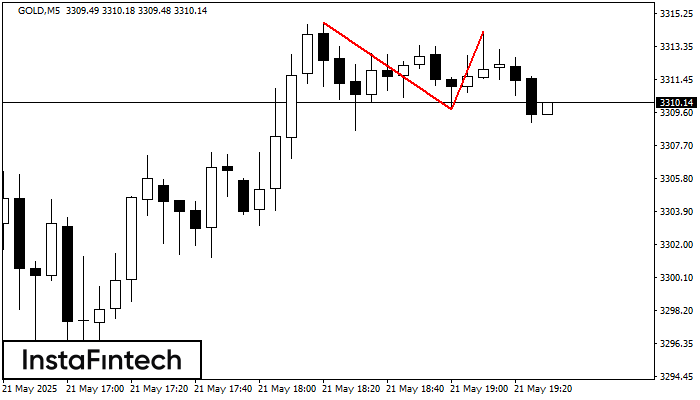
The Double Top reversal pattern has been formed on GOLD M5. Characteristics: the upper boundary 3314.76; the lower boundary 3309.74; the width of the pattern is 449 points. Sell trades
The M5 and M15 time frames may have more false entry points.
Open chart in a new window


