

Patrones actuales

Los patrones son modelos gráficos que se forman en el gráfico mediante el precio. Según uno de los postulados del análisis técnico, la historia (movimiento del precio) se repite. Esto quiere decir que los movimientos del precio a menudo son similares en las mismas situaciones que hacen posible pronosticar el futuro desarrollo de la situación con una alta probabilidad.
Los patrones relevantes de InstaTrade son un servicio fácil de utilizar que permiten que conozca los últimos cambios en el mercado y reaccione a las pistas del mercado a tiempo. En nuestro servicio, siempre encontrará los últimos y más importantes patrones en cualquier par y en cualquier marco de tiempo.
Bearish Flag
was formed on 04.04 at 17:33:26 (UTC+0)
signal strength 2 of 5
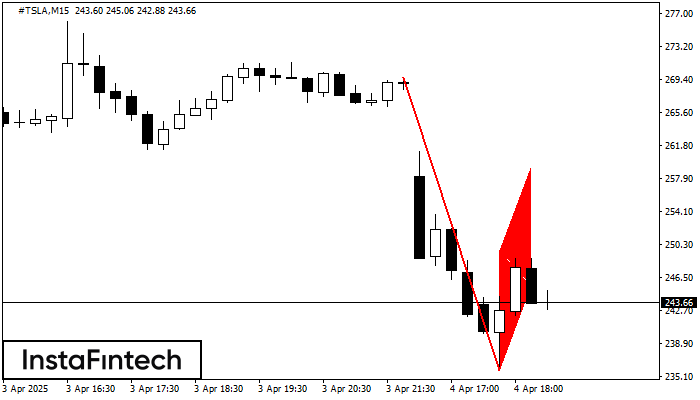
The Bearish Flag pattern has been formed on the chart #TSLA M15. Therefore, the downwards trend is likely to continue in the nearest term. As soon as the price breaks below the low at 235.81, traders should enter the market.
The M5 and M15 time frames may have more false entry points.
- All
- All
- Bearish Rectangle
- Bearish Symmetrical Triangle
- Bearish Symmetrical Triangle
- Bullish Rectangle
- Double Top
- Double Top
- Triple Bottom
- Triple Bottom
- Triple Top
- Triple Top
- All
- All
- Buy
- Sale
- All
- 1
- 2
- 3
- 4
- 5
Rectángulo Bajista
was formed on 20.04 at 19:17:25 (UTC+0)
signal strength 1 of 5

Según el gráfico de M5, #Bitcoin formó el Rectángulo Bajista que es un patrón de la continuación de una tendencia. El patrón está contenido dentro de los siguientes límites: límite
Los marcos de tiempo M5 y M15 pueden tener más puntos de entrada falsos.
Open chart in a new window
Doble Piso
was formed on 20.04 at 18:15:23 (UTC+0)
signal strength 1 of 5

El patrón Doble Piso ha sido formado en #Bitcoin M5; el límite superior es 84636.40; el límite inferior es 84234.35. El ancho del patrón es 42295 puntos. En caso
Los marcos de tiempo M5 y M15 pueden tener más puntos de entrada falsos.
Open chart in a new window
Doble Techo
was formed on 20.04 at 00:11:29 (UTC+0)
signal strength 1 of 5

El patrón Doble Techo ha sido formado en #Bitcoin M5. Esto señala que la tendencia ha sido cambiada de alcista a bajista. Probablemente, si la base del patrón 85200.45
Los marcos de tiempo M5 y M15 pueden tener más puntos de entrada falsos.
Open chart in a new window


