

Patrones actuales

Los patrones son modelos gráficos que se forman en el gráfico mediante el precio. Según uno de los postulados del análisis técnico, la historia (movimiento del precio) se repite. Esto quiere decir que los movimientos del precio a menudo son similares en las mismas situaciones que hacen posible pronosticar el futuro desarrollo de la situación con una alta probabilidad.
Los patrones relevantes de InstaTrade son un servicio fácil de utilizar que permiten que conozca los últimos cambios en el mercado y reaccione a las pistas del mercado a tiempo. En nuestro servicio, siempre encontrará los últimos y más importantes patrones en cualquier par y en cualquier marco de tiempo.
Bearish pennant
was formed on 03.04 at 20:01:45 (UTC+0)
signal strength 4 of 5
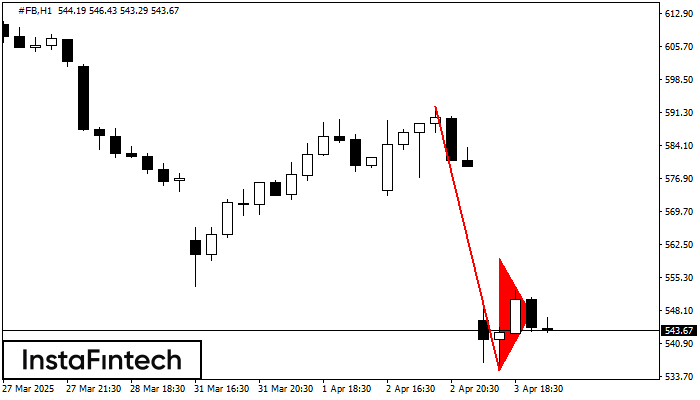
The Bearish pennant pattern has formed on the #FB H1 chart. The pattern signals continuation of the downtrend in case the pennant’s low of 535.05 is broken through. Recommendations: Place the sell stop pending order 10 pips below the pattern’s low. Place the take profit order at the projection distance of the flagpole height.
- All
- All
- Bearish Rectangle
- Bearish Symmetrical Triangle
- Bearish Symmetrical Triangle
- Bullish Rectangle
- Double Top
- Double Top
- Triple Bottom
- Triple Bottom
- Triple Top
- Triple Top
- All
- All
- Buy
- Sale
- All
- 1
- 2
- 3
- 4
- 5
Double Top
was formed on 21.05 at 20:30:53 (UTC+0)
signal strength 3 of 5
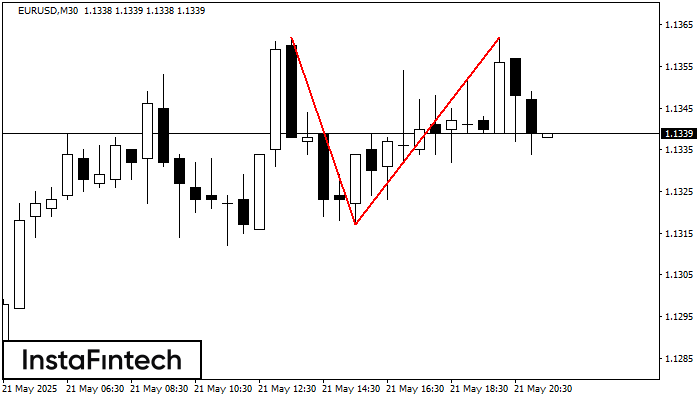
The Double Top pattern has been formed on EURUSD M30. It signals that the trend has been changed from upwards to downwards. Probably, if the base of the pattern 1.1317
Open chart in a new window
Bearish Rectangle
was formed on 21.05 at 19:30:17 (UTC+0)
signal strength 4 of 5
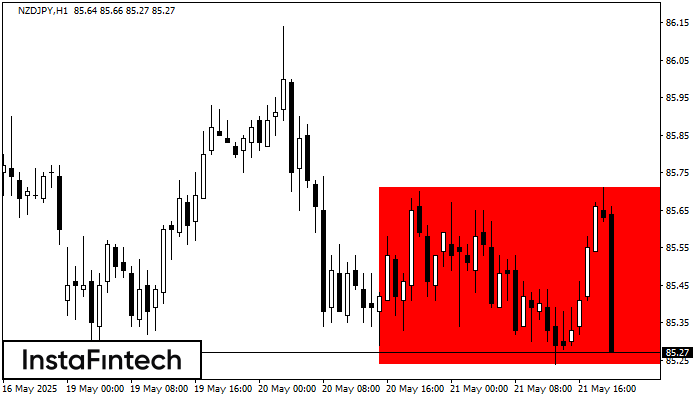
According to the chart of H1, NZDJPY formed the Bearish Rectangle which is a pattern of a trend continuation. The pattern is contained within the following borders: lower border 85.24
Open chart in a new window
Bearish Rectangle
was formed on 21.05 at 19:27:17 (UTC+0)
signal strength 4 of 5
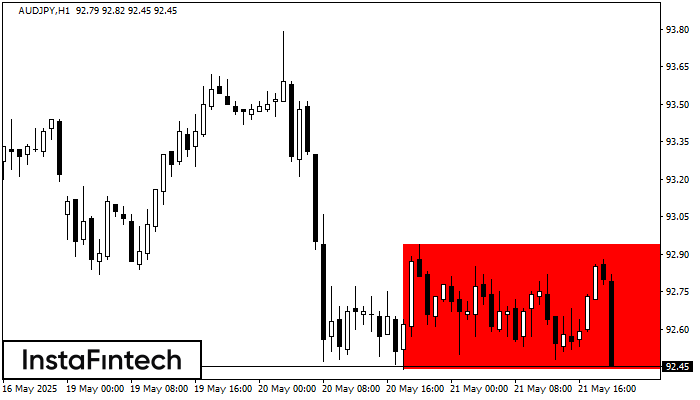
According to the chart of H1, AUDJPY formed the Bearish Rectangle. The pattern indicates a trend continuation. The upper border is 92.94, the lower border is 92.44. The signal means
Open chart in a new window


