

Patrones actuales

Los patrones son modelos gráficos que se forman en el gráfico mediante el precio. Según uno de los postulados del análisis técnico, la historia (movimiento del precio) se repite. Esto quiere decir que los movimientos del precio a menudo son similares en las mismas situaciones que hacen posible pronosticar el futuro desarrollo de la situación con una alta probabilidad.
Los patrones relevantes de InstaTrade son un servicio fácil de utilizar que permiten que conozca los últimos cambios en el mercado y reaccione a las pistas del mercado a tiempo. En nuestro servicio, siempre encontrará los últimos y más importantes patrones en cualquier par y en cualquier marco de tiempo.
Double Bottom
was formed on 03.04 at 17:09:50 (UTC+0)
signal strength 1 of 5
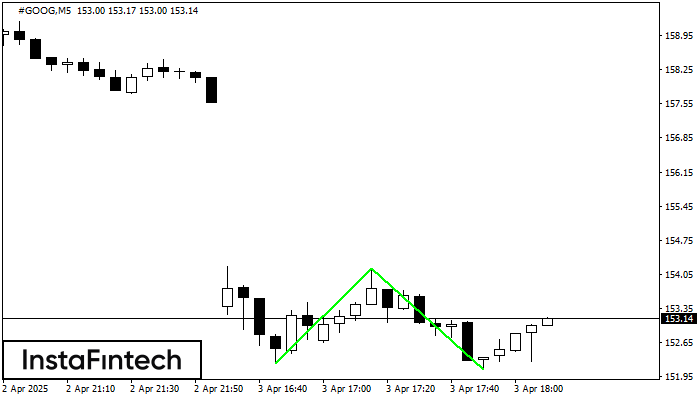
The Double Bottom pattern has been formed on #GOOG M5. Characteristics: the support level 152.21; the resistance level 154.17; the width of the pattern 196 points. If the resistance level is broken, a change in the trend can be predicted with the first target point lying at the distance of 207 points.
The M5 and M15 time frames may have more false entry points.
- All
- All
- Bearish Rectangle
- Bearish Symmetrical Triangle
- Bearish Symmetrical Triangle
- Bullish Rectangle
- Double Top
- Double Top
- Triple Bottom
- Triple Bottom
- Triple Top
- Triple Top
- All
- All
- Buy
- Sale
- All
- 1
- 2
- 3
- 4
- 5
Double Top
was formed on 22.05 at 19:15:10 (UTC+0)
signal strength 1 of 5
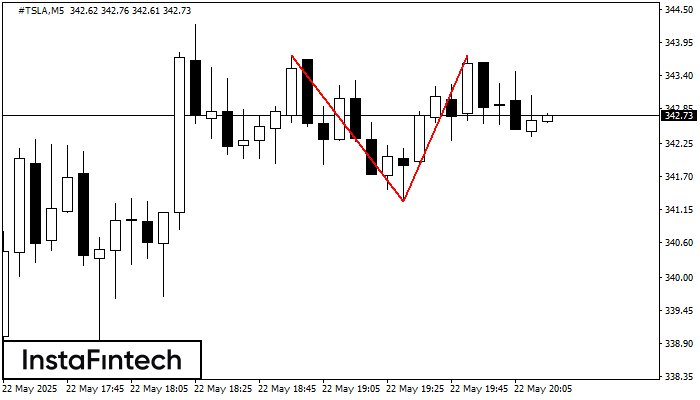
The Double Top reversal pattern has been formed on #TSLA M5. Characteristics: the upper boundary 343.73; the lower boundary 341.29; the width of the pattern is 245 points. Sell trades
The M5 and M15 time frames may have more false entry points.
Open chart in a new window
Double Top
was formed on 22.05 at 19:10:28 (UTC+0)
signal strength 1 of 5
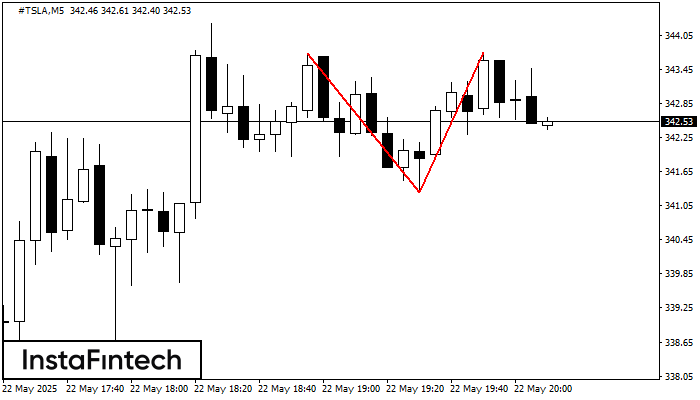
On the chart of #TSLA M5 the Double Top reversal pattern has been formed. Characteristics: the upper boundary 343.74; the lower boundary 341.29; the width of the pattern 245 points
The M5 and M15 time frames may have more false entry points.
Open chart in a new window
Double Top
was formed on 22.05 at 18:35:37 (UTC+0)
signal strength 1 of 5
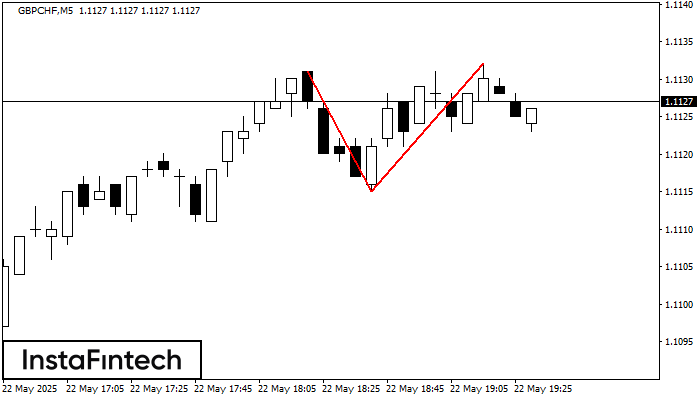
On the chart of GBPCHF M5 the Double Top reversal pattern has been formed. Characteristics: the upper boundary 1.1132; the lower boundary 1.1115; the width of the pattern 17 points
The M5 and M15 time frames may have more false entry points.
Open chart in a new window


