

Patrones actuales

Los patrones son modelos gráficos que se forman en el gráfico mediante el precio. Según uno de los postulados del análisis técnico, la historia (movimiento del precio) se repite. Esto quiere decir que los movimientos del precio a menudo son similares en las mismas situaciones que hacen posible pronosticar el futuro desarrollo de la situación con una alta probabilidad.
Los patrones relevantes de InstaTrade son un servicio fácil de utilizar que permiten que conozca los últimos cambios en el mercado y reaccione a las pistas del mercado a tiempo. En nuestro servicio, siempre encontrará los últimos y más importantes patrones en cualquier par y en cualquier marco de tiempo.
Bearish Rectangle
was formed on 24.03 at 22:46:30 (UTC+0)
signal strength 3 of 5
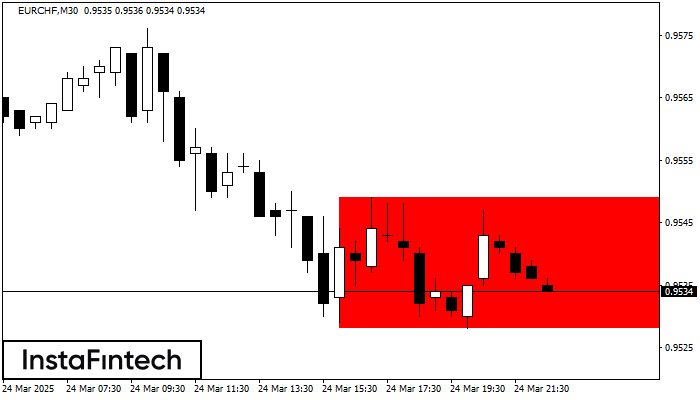
According to the chart of M30, EURCHF formed the Bearish Rectangle. This type of a pattern indicates a trend continuation. It consists of two levels: resistance 0.9549 - 0.0000 and support 0.9528 – 0.9528. In case the resistance level 0.9528 - 0.9528 is broken, the instrument is likely to follow the bearish trend.
- All
- All
- Bearish Rectangle
- Bearish Symmetrical Triangle
- Bearish Symmetrical Triangle
- Bullish Rectangle
- Double Top
- Double Top
- Triple Bottom
- Triple Bottom
- Triple Top
- Triple Top
- All
- All
- Buy
- Sale
- All
- 1
- 2
- 3
- 4
- 5
Head and Shoulders
was formed on 22.05 at 17:00:26 (UTC+0)
signal strength 4 of 5
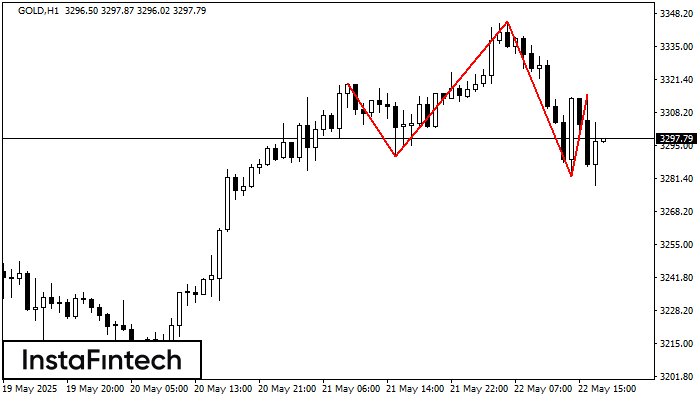
The GOLD H1 formed the Head and Shoulders pattern with the following features: The Head’s top is at 3344.99, the Neckline and the upward angle are at 3290.48/3282.56. The formation
Open chart in a new window
Bearish Symmetrical Triangle
was formed on 22.05 at 16:50:59 (UTC+0)
signal strength 1 of 5
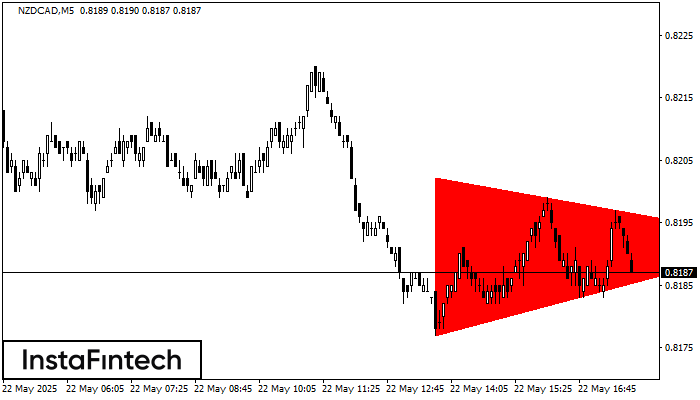
According to the chart of M5, NZDCAD formed the Bearish Symmetrical Triangle pattern. Description: The lower border is 0.8177/0.8192 and upper border is 0.8202/0.8192. The pattern width is measured
The M5 and M15 time frames may have more false entry points.
Open chart in a new window
Triple Bottom
was formed on 22.05 at 16:50:25 (UTC+0)
signal strength 1 of 5
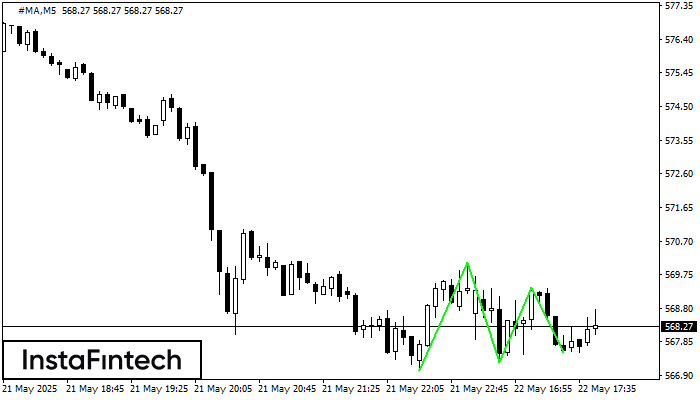
The Triple Bottom pattern has been formed on #MA M5. It has the following characteristics: resistance level 570.10/569.39; support level 567.05/567.54; the width is 305 points. In the event
The M5 and M15 time frames may have more false entry points.
Open chart in a new window


