

Patrones actuales

Los patrones son modelos gráficos que se forman en el gráfico mediante el precio. Según uno de los postulados del análisis técnico, la historia (movimiento del precio) se repite. Esto quiere decir que los movimientos del precio a menudo son similares en las mismas situaciones que hacen posible pronosticar el futuro desarrollo de la situación con una alta probabilidad.
Los patrones relevantes de InstaTrade son un servicio fácil de utilizar que permiten que conozca los últimos cambios en el mercado y reaccione a las pistas del mercado a tiempo. En nuestro servicio, siempre encontrará los últimos y más importantes patrones en cualquier par y en cualquier marco de tiempo.
Bullish Symmetrical Triangle
was formed on 19.03 at 18:02:02 (UTC+0)
signal strength 3 of 5
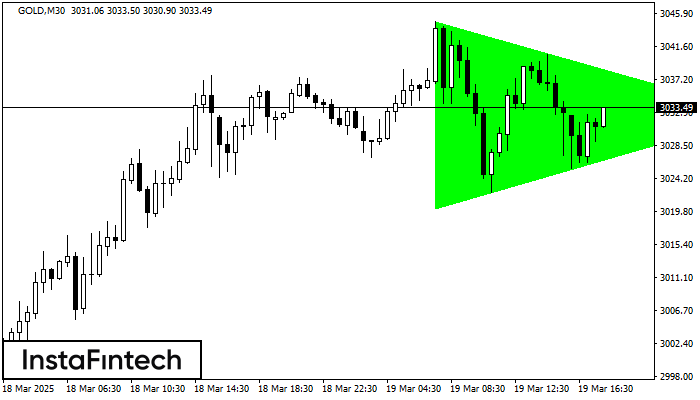
According to the chart of M30, GOLD formed the Bullish Symmetrical Triangle pattern, which signals the trend will continue. Description. The upper border of the pattern touches the coordinates 3044.87/3032.56 whereas the lower border goes across 3020.18/3032.56. The pattern width is measured on the chart at 2469 pips. If the Bullish Symmetrical Triangle pattern is in progress during the upward trend, this indicates the current trend will go on. In case 3032.56 is broken, the price could continue its move toward 3032.86.
- All
- All
- Bearish Rectangle
- Bearish Symmetrical Triangle
- Bearish Symmetrical Triangle
- Bullish Rectangle
- Double Top
- Double Top
- Triple Bottom
- Triple Bottom
- Triple Top
- Triple Top
- All
- All
- Buy
- Sale
- All
- 1
- 2
- 3
- 4
- 5
Triángulo Simétrico Bajista
was formed on 23.05 at 00:42:21 (UTC+0)
signal strength 2 of 5
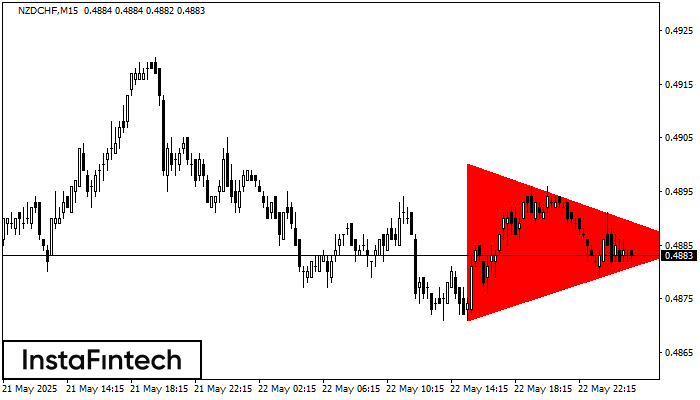
Según el gráfico de M15, el NZDCHF formó el patrón Triángulo Simétrico Bajista. Recomendaciones de negociación: es posible que una ruptura del límite inferior 0.4871 fomente una continuación
Los marcos de tiempo M5 y M15 pueden tener más puntos de entrada falsos.
Open chart in a new window
Doble Piso
was formed on 23.05 at 00:40:02 (UTC+0)
signal strength 1 of 5
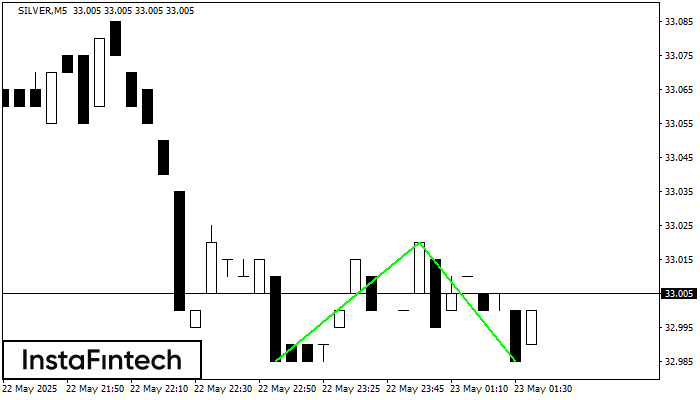
El patrón Doble Piso ha sido formado en SILVER M5. Esta formación señala una reversión de la tendencia de bajista a alcista. La señal es que se debe abrir
Los marcos de tiempo M5 y M15 pueden tener más puntos de entrada falsos.
Open chart in a new window
Triángulo Simétrico Bajista
was formed on 23.05 at 00:27:26 (UTC+0)
signal strength 1 of 5
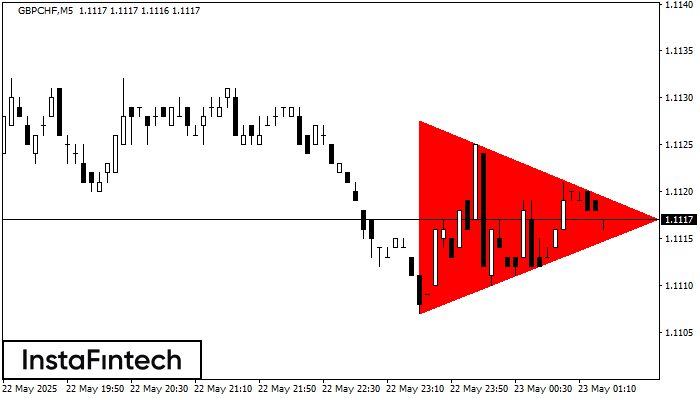
Según el gráfico de M5, el GBPCHF formó el patrón Triángulo Simétrico Bajista. Recomendaciones de negociación: es posible que una ruptura del límite inferior 1.1107 fomente una continuación
Los marcos de tiempo M5 y M15 pueden tener más puntos de entrada falsos.
Open chart in a new window


