Vea también


 08.04.2025 07:29 PM
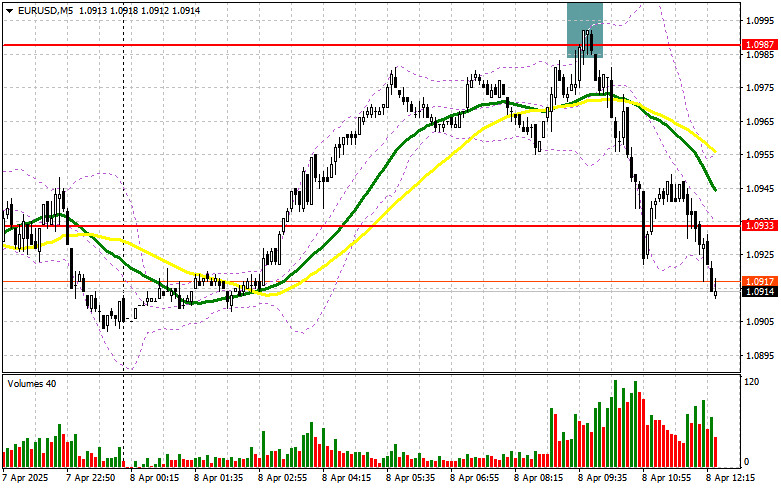
In my morning forecast, I focused on the 1.0987 level and planned to make trading decisions from it. Let's look at the 5-minute chart and see what happened there. A rise and formation of a false breakout at that level provided a good entry point for short positions, resulting in a 50-point drop in the euro. The technical picture has been revised for the second half of the day.
To open long positions on EURUSD:
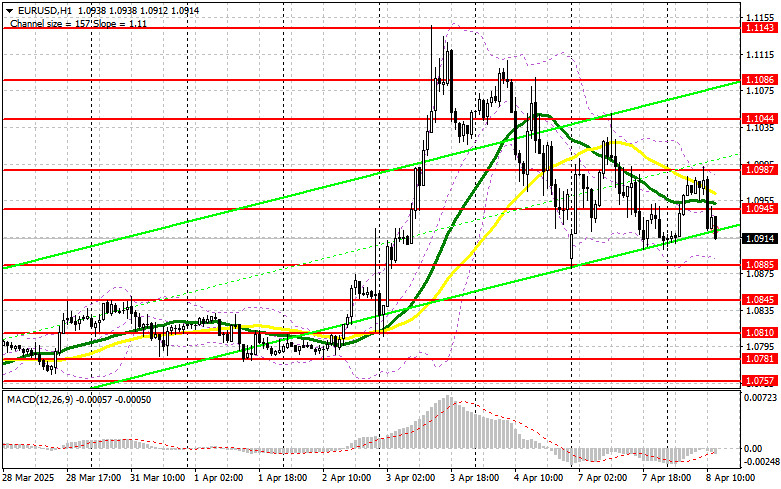
Market volatility remains high, and the lack of important and positive statistics from the Eurozone helps euro sellers become active on any decent rally in the pair. In the second half of the day, only the NFIB Small Business Optimism Index will be released, which is of little interest to currency traders. There will also be a speech by FOMC member Mary Daly, but her remarks are unlikely to have a significant impact on the US dollar. If the euro declines following the reports and speeches, a false breakout around the 1.0885 support area will serve as a signal to buy EUR/USD with the prospect of a bullish market recovery and a retest of 1.0945. A breakout and retest of this range will confirm the correct entry point for buying, aiming at 1.0987, a level that has yet to be surpassed. The ultimate target will be 1.1044, where I will take profit. If EUR/USD declines and shows no activity around 1.0885, pressure on the euro will increase significantly, and the market will shift fully to the sellers' side. In that case, bears may push the pair down to 1.0845. Only after a false breakout forms there will I consider buying the euro. I also plan to open long positions on a rebound from 1.0810, aiming for a 30–35 point intraday correction.
To open short positions on EURUSD:
Sellers have once again proven effective, successfully defending the 1.0987 resistance in the morning. Now I'd like to see the same at 1.0945. If there is a negative market reaction to US data, a false breakout at this level will be enough to enter short positions with a target at the 1.0885 support area. A breakout and consolidation below this range will be a suitable sell signal, with a move toward 1.0845. The ultimate target will be 1.0810, where I plan to take profit. If EUR/USD rises again in the second half of the day and bears do not act around 1.0945, buyers could push the pair back to the daily highs. In this case, I will postpone short positions until the next resistance at 1.0987 is tested. I will sell there only after a failed consolidation, similar to what was discussed earlier. I also plan to open short positions on a rebound from 1.1044, targeting a 30–35 point downward correction.
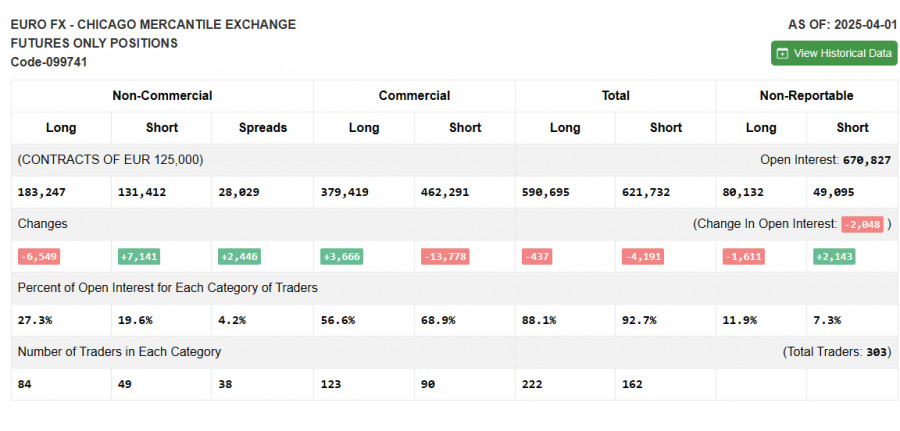
COT Report (Commitment of Traders) as of April 1: A slight increase in short positions and a decrease in long ones was observed. However, it's important to note that this report does not take into account the new US tariffs against key trade partners or the latest March labor market data from the US. Therefore, there's little point in deeply analyzing position dynamics, as it doesn't reflect current reality. The COT report shows that long non-commercial positions declined by 6,549 to 183,247, while short non-commercial positions rose by 7,141 to 131,412. As a result, the gap between long and short positions increased by 2,466.
Indicator signals:
Moving averages Trading is conducted around the 30- and 50-period moving averages, indicating market uncertainty.
Note: The period and prices of the moving averages are considered by the author on the H1 hourly chart and differ from the classic daily moving average definitions on the D1 chart.
Bollinger Bands In the event of a decline, the lower boundary of the indicator around 1.0885 will act as support.
Indicator descriptions: • Moving average – defines the current trend by smoothing volatility and noise. Period – 50 (marked in yellow on the chart); • Moving average – period – 30 (marked in green on the chart); • MACD indicator (Moving Average Convergence/Divergence) – fast EMA: period 12, slow EMA: period 26, SMA: period 9; • Bollinger Bands – period 20; • Non-commercial traders – speculators such as individual traders, hedge funds, and large institutions using the futures market for speculative purposes and meeting specific criteria; • Long non-commercial positions – total long open positions held by non-commercial traders; • Short non-commercial positions – total short open positions held by non-commercial traders; • Net non-commercial position – the difference between short and long positions of non-commercial traders.
You have already liked this post today
*El análisis de mercado publicado aquí tiene la finalidad de incrementar su conocimiento, más no darle instrucciones para realizar una operación.
Ayer se formaron varios puntos de entrada al mercado. Veamos el gráfico de 5 minutos y analicemos lo que ocurrió. En mi pronóstico matutino, presté atención al nivel 1.3545
Ayer se formaron varios puntos de entrada al mercado. Veamos el gráfico de 5 minutos y analicemos lo que ocurrió. En mi pronóstico matutino, presté atención al nivel 1.1374
Para abrir posiciones largas en el par GBP/USD se requiere: La libra esterlina continúa fortaleciéndose, y las recientes decisiones de EE. UU. en relación con los aranceles comerciales le están
Para abrir posiciones largas en el par EUR/USD se requiere: Las noticias de que Trump pospuso la introducción de aranceles elevados a productos de la UE hasta
El par de divisas GBP/USD también reanudó su movimiento ascendente el miércoles. El crecimiento de la libra esterlina, que en realidad sigue siendo una caída del dólar estadounidense, comenzó durante
El par de divisas EUR/USD reanudó su movimiento ascendente durante el miércoles, y ahora se puede decir que existe una tendencia alcista no solo en el marco temporal
GBP/USD: plan para la sesión europea del 9 de mayo. Informes COT (Commitment of Traders, análisis de las operaciones de ayer). La libra se desplomó tras la bajada de tasas
Ayer se formaron varios puntos de entrada al mercado. Veamos el gráfico de 5 minutos y analicemos lo que ocurrió. En mi pronóstico matutino presté atención al nivel de 1.1269
Ayer se formaron varios puntos de entrada al mercado. Veamos el gráfico de 5 minutos y analicemos lo que ocurrió. En mi pronóstico matutino presté atención al nivel 1.3335
Ayer se formaron varios puntos de entrada al mercado. Veamos el gráfico de 5 minutos y analicemos lo que ocurrió. En mi pronóstico matutino presté atención al nivel 1.1379
Ferrari F8 TRIBUTO
de InstaForex
InstaForex en cifras

Your IP address shows that you are currently located in the USA. If you are a resident of the United States, you are prohibited from using the services of InstaFintech Group including online trading, online transfers, deposit/withdrawal of funds, etc.
If you think you are seeing this message by mistake and your location is not the US, kindly proceed to the website. Otherwise, you must leave the website in order to comply with government restrictions.
Why does your IP address show your location as the USA?
Please confirm whether you are a US resident or not by clicking the relevant button below. If you choose the wrong option, being a US resident, you will not be able to open an account with InstaTrade anyway.
We are sorry for any inconvenience caused by this message.


