

Actual patterns

Patterns are graphical models which are formed in the chart by the price. According to one of the technical analysis postulates, history (price movement) repeats itself. It means that the price movements are often similar in the same situations which makes it possible to predict the further development of the situation with a high probability.
Relevant patterns by InstaTrade is an easy-to-use service which allows you to be aware of latest changes in the market and react to clues from the market in time. In our service you will always find the latest and most relevant patterns on any pair and any timeframe.
Bearish pennant
was formed on 08.04 at 18:17:34 (UTC+0)
signal strength 1 of 5
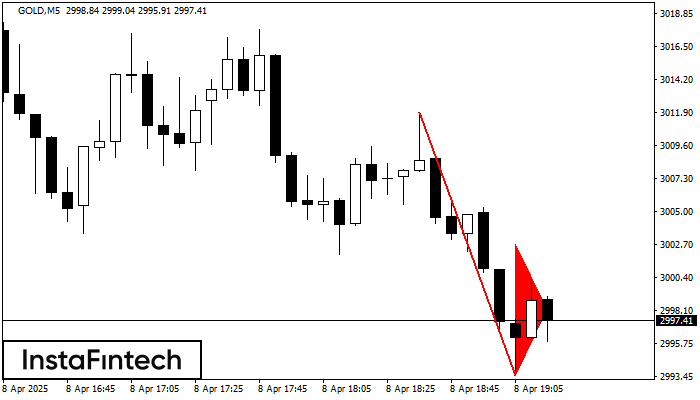
The Bearish pennant pattern has formed on the GOLD M5 chart. This pattern type is characterized by a slight slowdown after which the price will move in the direction of the original trend. In case the price fixes below the pattern’s low of 2993.55, a trader will be able to successfully enter the sell position.
The M5 and M15 time frames may have more false entry points.
- All
- All
- Bearish Rectangle
- Bearish Symmetrical Triangle
- Bearish Symmetrical Triangle
- Bullish Rectangle
- Double Top
- Double Top
- Triple Bottom
- Triple Bottom
- Triple Top
- Triple Top
- All
- All
- Buy
- Sale
- All
- 1
- 2
- 3
- 4
- 5
Медвежий вымпел
сформирован 05.06 в 16:45:18 (UTC+0)
сила сигнала 2 из 5

По торговому инструменту #TSLA на M15 сформировалась графическая фигура «Медвежий вымпел». Фигура данного типа характеризует небольшое замедление, после которого движение продолжится в исходном тренде. В случае если котировке удастся зафиксироваться
Таймфреймы М5 и М15 могут иметь больше ложных точек входа.
Открыть график инструмента в новом окне
Медвежий вымпел
сформирован 05.06 в 16:45:10 (UTC+0)
сила сигнала 2 из 5
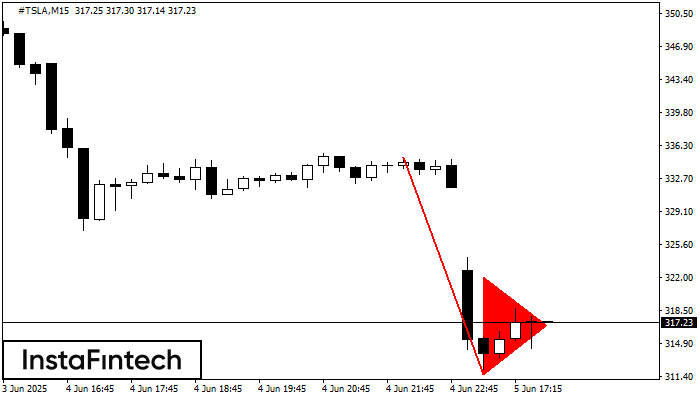
На графике #TSLA M15 сформировалась фигура «Медвежий вымпел», которая сигнализирует о возможном продолжении тренда. Характеристика: основание фигуры имеет координаты 311.59; проекция высоты флагштока равна 2342 пунктов. В случае если цена
Таймфреймы М5 и М15 могут иметь больше ложных точек входа.
Открыть график инструмента в новом окне
Двойная вершина
сформирован 05.06 в 16:40:32 (UTC+0)
сила сигнала 1 из 5
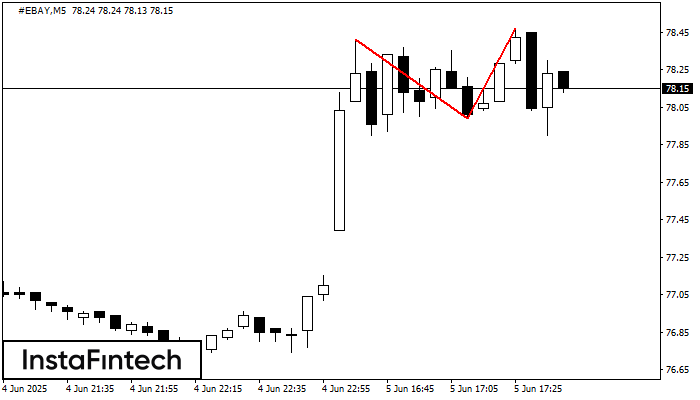
По торговому инструменту #EBAY на M5 сформировалась фигура «Двойная вершина», которая сигнализирует нам об изменении тенденции с восходящей на нисходящую. Вероятно, что, в случае пробоя основания фигуры 77.99, возможно дальнейшее
Таймфреймы М5 и М15 могут иметь больше ложных точек входа.
Открыть график инструмента в новом окне


