

Actual patterns

Patterns are graphical models which are formed in the chart by the price. According to one of the technical analysis postulates, history (price movement) repeats itself. It means that the price movements are often similar in the same situations which makes it possible to predict the further development of the situation with a high probability.
Relevant patterns by InstaTrade is an easy-to-use service which allows you to be aware of latest changes in the market and react to clues from the market in time. In our service you will always find the latest and most relevant patterns on any pair and any timeframe.
Triple Bottom
was formed on 07.04 at 03:10:11 (UTC+0)
signal strength 1 of 5

The Triple Bottom pattern has been formed on GOLD M5. It has the following characteristics: resistance level 3009.08/2992.38; support level 2976.74/2972.63; the width is 3234 points. In the event of a breakdown of the resistance level of 3009.08, the price is likely to continue an upward movement at least to 2971.02.
The M5 and M15 time frames may have more false entry points.
- All
- All
- Bearish Rectangle
- Bearish Symmetrical Triangle
- Bearish Symmetrical Triangle
- Bullish Rectangle
- Double Top
- Double Top
- Triple Bottom
- Triple Bottom
- Triple Top
- Triple Top
- All
- All
- Buy
- Sale
- All
- 1
- 2
- 3
- 4
- 5
Bawah Ganda
was formed on 04.06 at 01:45:26 (UTC+0)
signal strength 2 of 5
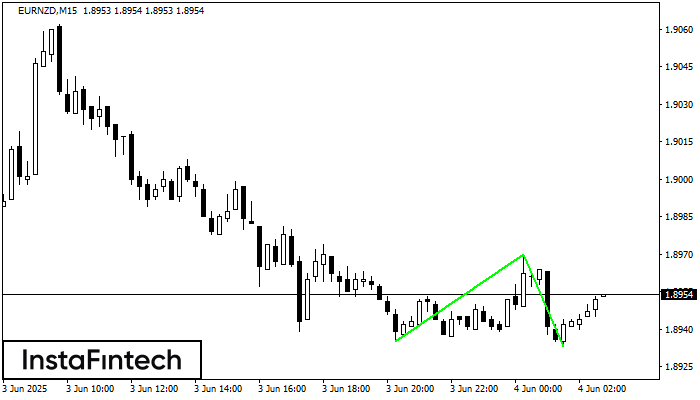
Pola Bawah Ganda telah terbentuk pada EURNZD M15; batas atas di 1.8970; batas bawah di 1.8933. Lebar pola sebesar 35 poin. Jika harga menembus batas atas 1.8970, Perubahan dalam tren
Rangka waktu M5 dan M15 mungkin memiliki lebih dari titik entri yang keliru.
Open chart in a new window
Teratas Ganda
was formed on 04.06 at 01:45:10 (UTC+0)
signal strength 2 of 5
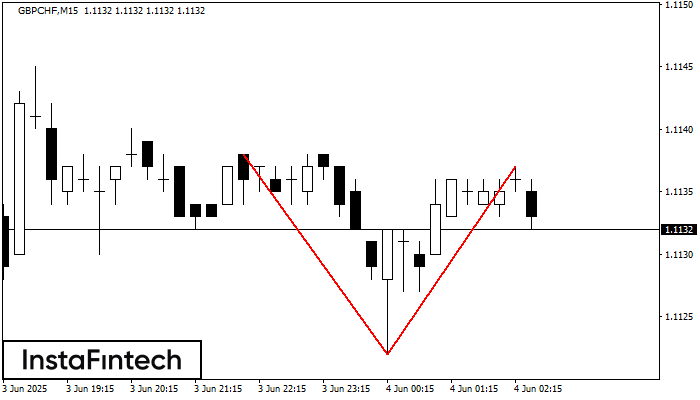
Pada grafik GBPCHF M15 pola reversal Teratas Ganda telah terbentuk. Karakteristik: batas atas 1.1137; batas bawah 1.1122; lebar pola 15 poin. Sinyal: tembusan ke batas bawah akan menyebabkan kelanjutan tren
Rangka waktu M5 dan M15 mungkin memiliki lebih dari titik entri yang keliru.
Open chart in a new window
Segitiga Simetris Bullish
was formed on 04.06 at 01:16:46 (UTC+0)
signal strength 1 of 5
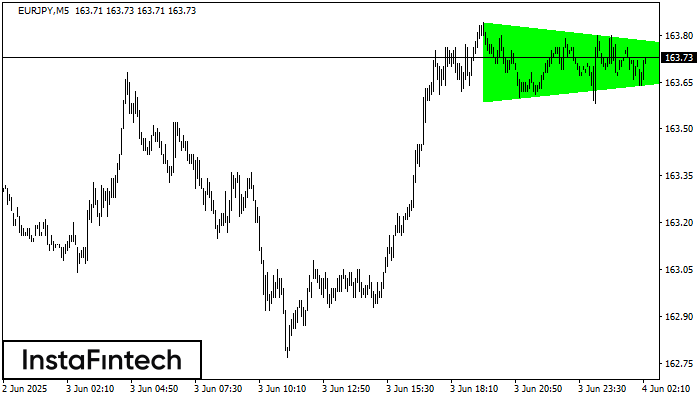
Menurut Grafik dari M5, EURJPY dibentuk pola Segitiga Simetris Bullish, yang menunjukkan tren akan berlanjut. Deksripsi. Batas atas dari pola menyentuh kordinat 163.84/163.71 dimana batas yang lebih rendah berada sepanjang
Rangka waktu M5 dan M15 mungkin memiliki lebih dari titik entri yang keliru.
Open chart in a new window


