Актуальные паттерны

Паттерны – это графические модели, которые "рисует" цена на графике. Один из постулатов технического анализа говорит нам о том, что история (движение цены) всегда повторяется. Это значит, что в похожих ситуациях движение цены, зачастую, будет похожим, что позволяет с высокой долей вероятности спрогнозировать дальнейшее развитие ситуации.
Актуальные паттерны от ИнстаФорекс – это удобный сервис, который позволит вам всегда быть в курсе последних изменений на рынке и вовремя реагировать на появившиеся подсказки от рынка. В нашем сервисе вы всегда найдете самые свежие и актуальные паттерны на любой паре и на любом таймфрейме.
Медвежий симметричный треугольник
сформирован 10.04 в 11:46:39 (UTC+0)
сила сигнала 1 из 5
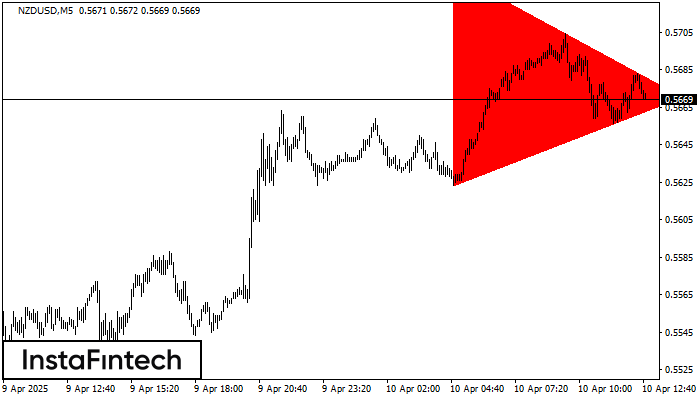
На графике NZDUSD на M5 сформировалась фигура «Медвежий симметричный треугольник». Торговые рекомендации: Пробой нижней границы 0.5623 с большой долей вероятности приведет к продолжению нисходящего тренда.
Таймфреймы М5 и М15 могут иметь больше ложных точек входа.
Смотрите также
- Все
- Все
- Bearish Rectangle
- Bearish Symmetrical Triangle
- Bearish Symmetrical Triangle
- Bullish Rectangle
- Double Top
- Double Top
- Triple Bottom
- Triple Bottom
- Triple Top
- Triple Top
- Все
- Все
- Покупка
- Продажа
- Все
- 1
- 2
- 3
- 4
- 5
বিয়ারিশ রেক্ট্যাঙ্গেল
was formed on 02.06 at 06:43:05 (UTC+0)
signal strength 1 of 5
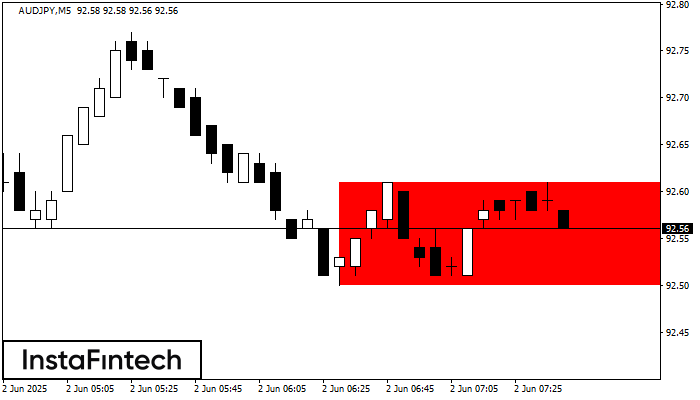
M5 চার্ট অনুযায়ী, AUDJPY বিয়ারিশ রেক্ট্যাঙ্গেল গঠন করেছে। এই প্যাটার্ন চলমান প্রবণতার ধারাবাহিকতা নির্দেশ করে। এটি দুটি স্তর নিয়ে গঠিত: 92.61 - 0.00-এর রেজিস্ট্যান্স এবং 92.50 - 92.50-এর সাপোর্ট৷ 92.50
M5 এবং M15 টাইম ফ্রেমে আরও ভুল এন্ট্রি পয়েন্ট থাকতে পারে।
Open chart in a new window
ডাবল বটম
was formed on 02.06 at 06:15:53 (UTC+0)
signal strength 2 of 5
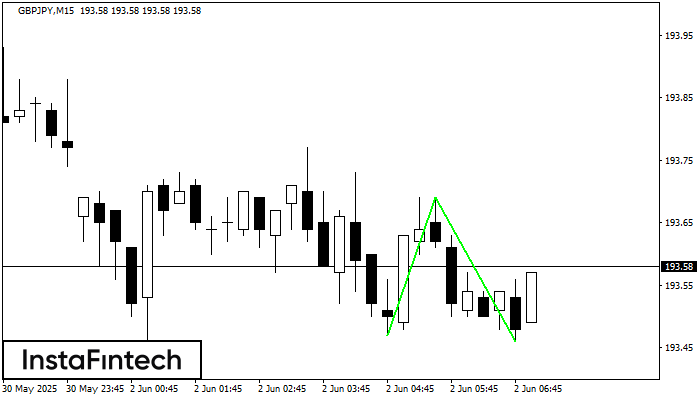
M15 চার্টে, GBPJPY-এর ডাবল বটম প্যাটার্নটি গঠিত হয়েছে। বৈশিষ্ট্য: সাপোর্ট স্তর হচ্ছে 193.47; রেজিস্ট্যান্স স্তর হচ্ছে 193.69; প্যাটার্নের প্রস্থ হচ্ছে 22 পয়েন্ট। রেজিস্ট্যান্স স্তর ভেদ করা হলে, 23 পয়েন্টের দূরত্বে
M5 এবং M15 টাইম ফ্রেমে আরও ভুল এন্ট্রি পয়েন্ট থাকতে পারে।
Open chart in a new window
বুলিশ রেক্ট্যাঙ্গেল
was formed on 02.06 at 06:00:14 (UTC+0)
signal strength 2 of 5
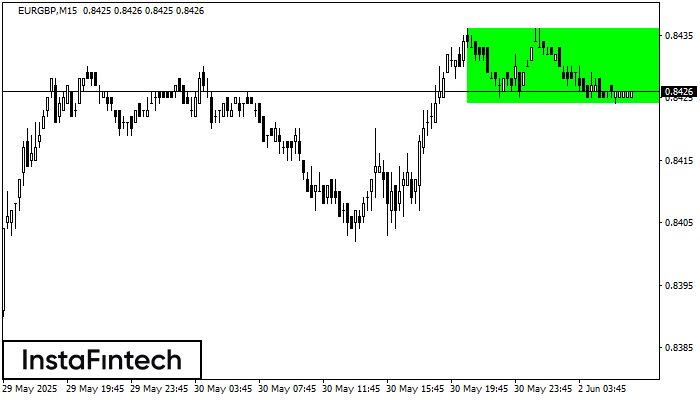
M15 চার্ট অনুযায়ী, EURGBP বুলিশ রেক্ট্যাঙ্গেল গঠন করেছে। এই প্যাটার্ন এই ধরনের প্রবণতার ধারাবাহিকতার নির্দেশ করে. এটি দুটি স্তর নিয়ে গঠিত: 0.8436 -এর রেজিস্ট্যান্স এবং 0.8424 -এর সাপোর্ট৷ রেজিস্ট্যান্স স্তর
M5 এবং M15 টাইম ফ্রেমে আরও ভুল এন্ট্রি পয়েন্ট থাকতে পারে।
Open chart in a new window