Актуальные паттерны

Паттерны – это графические модели, которые "рисует" цена на графике. Один из постулатов технического анализа говорит нам о том, что история (движение цены) всегда повторяется. Это значит, что в похожих ситуациях движение цены, зачастую, будет похожим, что позволяет с высокой долей вероятности спрогнозировать дальнейшее развитие ситуации.
Актуальные паттерны от ИнстаФорекс – это удобный сервис, который позволит вам всегда быть в курсе последних изменений на рынке и вовремя реагировать на появившиеся подсказки от рынка. В нашем сервисе вы всегда найдете самые свежие и актуальные паттерны на любой паре и на любом таймфрейме.
Перевернутая голова и плечи
сформирован 07.04 в 03:00:19 (UTC+0)
сила сигнала 1 из 5

По NZDCAD на M5 сформировалась фигура «Перевернутая голова и плечи». Вершина головы закреплена на 0.7904, при этом средняя линия шеи расположена на 0.7863/0.7887. Формирование фигуры «Перевернутая голова и плечи» наиболее вероятным образом свидетельствует о развороте восходящего тренда. Это означает, что курс NZDCAD, в случае срабатывания фигуры, пойдет в направлении 0.7919 (10 - 20 пунктов).
Таймфреймы М5 и М15 могут иметь больше ложных точек входа.
Смотрите также
- Все
- Все
- Bearish Rectangle
- Bearish Symmetrical Triangle
- Bearish Symmetrical Triangle
- Bullish Rectangle
- Double Top
- Double Top
- Triple Bottom
- Triple Bottom
- Triple Top
- Triple Top
- Все
- Все
- Покупка
- Продажа
- Все
- 1
- 2
- 3
- 4
- 5
Bullish Rectangle
was formed on 05.09 at 05:26:01 (UTC+0)
signal strength 1 of 5
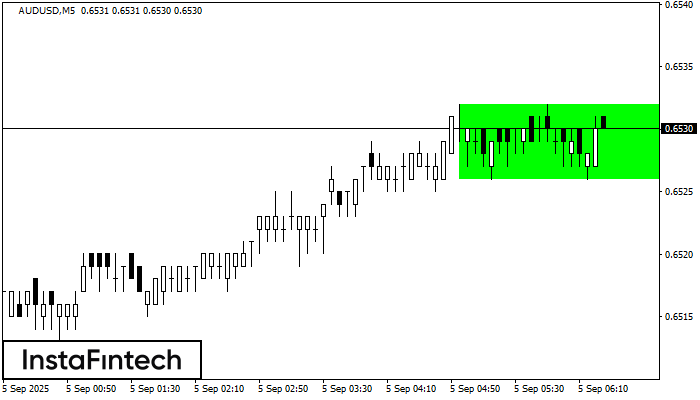
According to the chart of M5, AUDUSD formed the Bullish Rectangle. The pattern indicates a trend continuation. The upper border is 0.6532, the lower border is 0.6526. The signal means
The M5 and M15 time frames may have more false entry points.
Open chart in a new window
Double Top
was formed on 05.09 at 05:05:31 (UTC+0)
signal strength 1 of 5
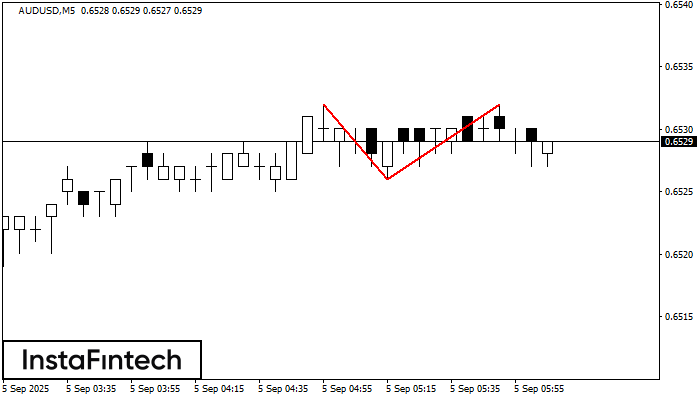
The Double Top reversal pattern has been formed on AUDUSD M5. Characteristics: the upper boundary 0.6532; the lower boundary 0.6526; the width of the pattern is 6 points. Sell trades
The M5 and M15 time frames may have more false entry points.
Open chart in a new window
Double Bottom
was formed on 05.09 at 04:35:43 (UTC+0)
signal strength 1 of 5
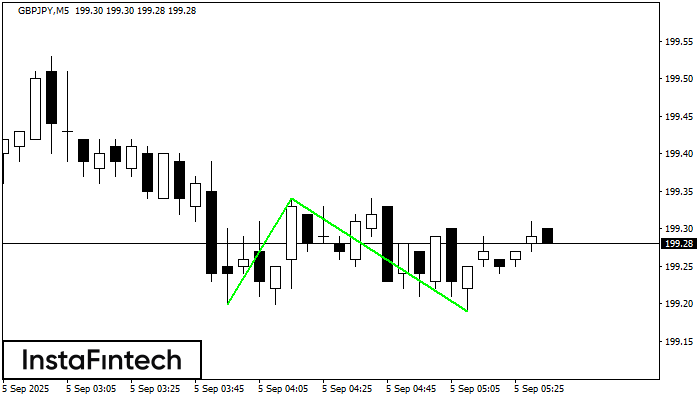
The Double Bottom pattern has been formed on GBPJPY M5; the upper boundary is 199.34; the lower boundary is 199.19. The width of the pattern is 14 points. In case
The M5 and M15 time frames may have more false entry points.
Open chart in a new window