Актуальные паттерны

Паттерны – это графические модели, которые "рисует" цена на графике. Один из постулатов технического анализа говорит нам о том, что история (движение цены) всегда повторяется. Это значит, что в похожих ситуациях движение цены, зачастую, будет похожим, что позволяет с высокой долей вероятности спрогнозировать дальнейшее развитие ситуации.
Актуальные паттерны от ИнстаФорекс – это удобный сервис, который позволит вам всегда быть в курсе последних изменений на рынке и вовремя реагировать на появившиеся подсказки от рынка. В нашем сервисе вы всегда найдете самые свежие и актуальные паттерны на любой паре и на любом таймфрейме.
Двойное дно
сформирован 30.03 в 23:00:20 (UTC+0)
сила сигнала 3 из 5
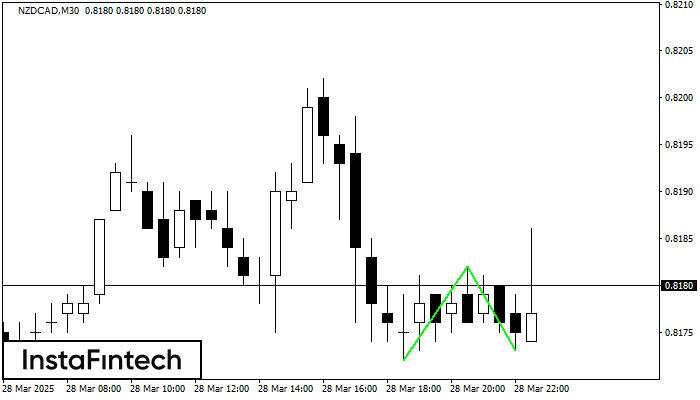
Сформирована фигура «Двойное дно» на графике NZDCAD M30. Данное формирование сигнализирует об изменении тенденции с нисходящего на восходящее движение. Сигнал: Торговую позицию на покупку следует открывать после пробоя верхней границы фигуры 0.8182, где перспектива будущего хода будет являться шириной текущей фигуры - 10 пунктов.
Смотрите также
- Все
- Все
- Bearish Rectangle
- Bearish Symmetrical Triangle
- Bearish Symmetrical Triangle
- Bullish Rectangle
- Double Top
- Double Top
- Triple Bottom
- Triple Bottom
- Triple Top
- Triple Top
- Все
- Все
- Покупка
- Продажа
- Все
- 1
- 2
- 3
- 4
- 5
Bearish Flag
was formed on 22.08 at 22:06:16 (UTC+0)
signal strength 1 of 5
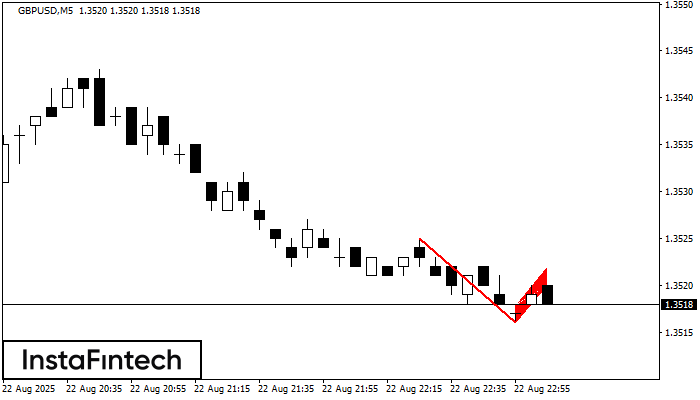
The Bearish Flag pattern has been formed on the chart GBPUSD M5. Therefore, the downwards trend is likely to continue in the nearest term. As soon as the price breaks
The M5 and M15 time frames may have more false entry points.
Open chart in a new window
Bearish pennant
was formed on 22.08 at 22:06:10 (UTC+0)
signal strength 1 of 5
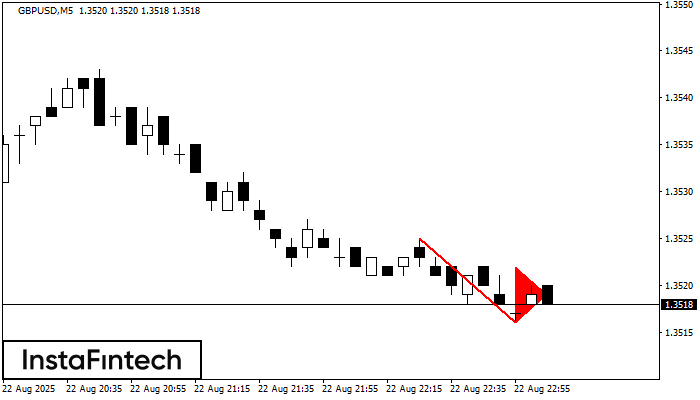
The Bearish pennant pattern has formed on the GBPUSD M5 chart. The pattern signals continuation of the downtrend in case the pennant’s low of 1.3516 is broken through. Recommendations: Place
The M5 and M15 time frames may have more false entry points.
Open chart in a new window
Head and Shoulders
was formed on 22.08 at 21:36:06 (UTC+0)
signal strength 1 of 5
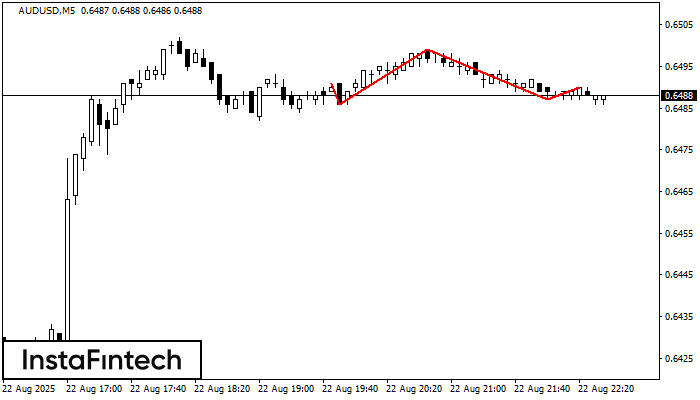
According to the chart of M5, AUDUSD formed the Head and Shoulders pattern. The Head’s top is set at 0.6499 while the median line of the Neck is found
The M5 and M15 time frames may have more false entry points.
Open chart in a new window