Triple Top
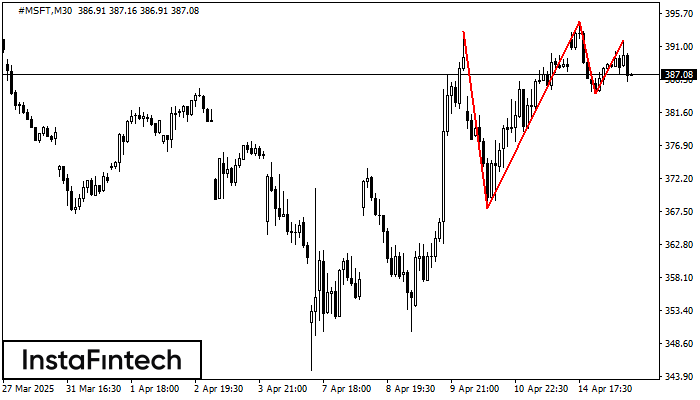
was formed on 15.04 at 16:30:04 (UTC+0)
signal strength 3 of 5

On the chart of the #MSFT M30 trading instrument, the Triple Top pattern that signals a trend change has formed. It is possible that after formation of the third peak, the price will try to break through the resistance level 367.97, where we advise to open a trading position for sale. Take profit is the projection of the pattern’s width, which is 2524 points.
- All
- All
- Bearish Rectangle
- Bearish Symmetrical Triangle
- Bearish Symmetrical Triangle
- Bullish Rectangle
- Double Top
- Double Top
- Triple Bottom
- Triple Bottom
- Triple Top
- Triple Top
- All
- All
- Buy
- Sale
- All
- 1
- 2
- 3
- 4
- 5
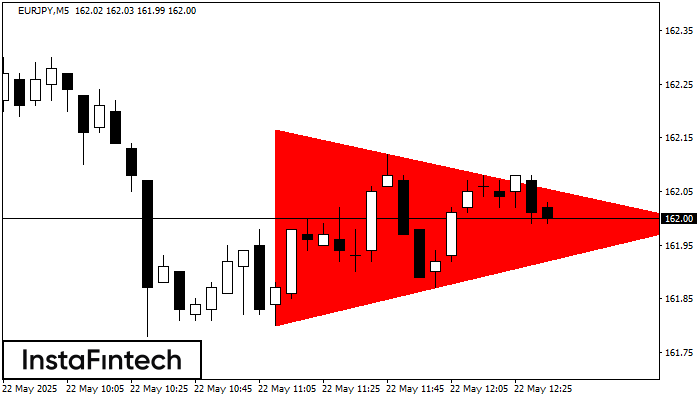
Triángulo Simétrico Bajista
was formed on 22.05 at 11:37:12 (UTC+0)
signal strength 1 of 5
Según el gráfico de M5, el EURJPY formó el patrón Triángulo Simétrico Bajista. Descripción: El límite inferior es 161.80/161.99 y el límite superior es 162.17/161.99. El ancho del patrón
Los marcos de tiempo M5 y M15 pueden tener más puntos de entrada falsos.
Open chart in a new window
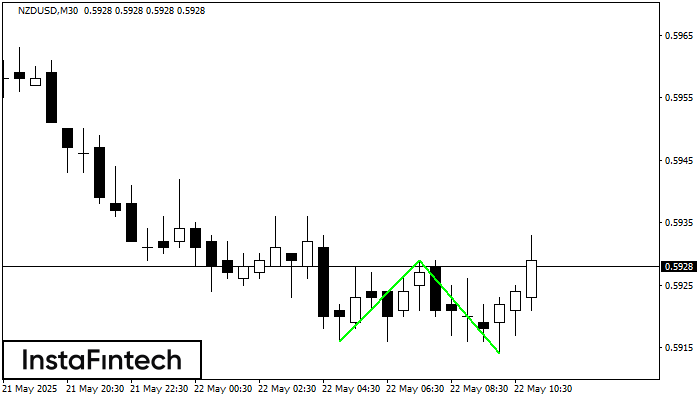
Doble Piso
was formed on 22.05 at 10:30:10 (UTC+0)
signal strength 3 of 5
El patrón Doble Piso ha sido formado en NZDUSD M30. Características: el nivel de soporte 0.5916; el nivel de resistencia 0.5929; el ancho del patrón 13 puntos. Si el nivel
Open chart in a new window
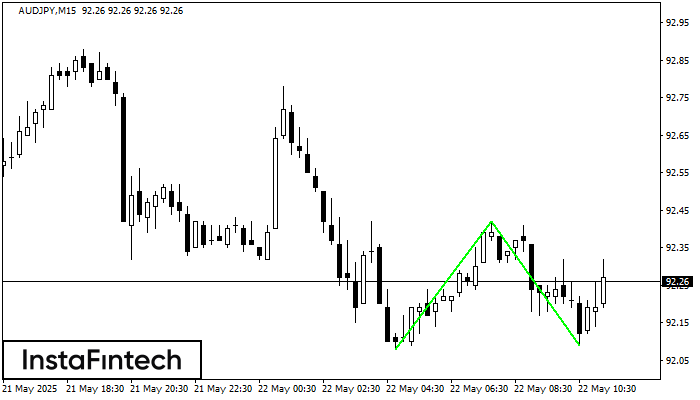
Doble Piso
was formed on 22.05 at 10:30:07 (UTC+0)
signal strength 2 of 5
El patrón Doble Piso ha sido formado en AUDJPY M15. Características: el nivel de soporte 92.08; el nivel de resistencia 92.42; el ancho del patrón 34 puntos. Si el nivel
Los marcos de tiempo M5 y M15 pueden tener más puntos de entrada falsos.
Open chart in a new window


