

Actual patterns

Patterns are graphical models which are formed in the chart by the price. According to one of the technical analysis postulates, history (price movement) repeats itself. It means that the price movements are often similar in the same situations which makes it possible to predict the further development of the situation with a high probability.
Relevant patterns by InstaTrade is an easy-to-use service which allows you to be aware of latest changes in the market and react to clues from the market in time. In our service you will always find the latest and most relevant patterns on any pair and any timeframe.
Bullish Flag
was formed on 15.04 at 11:20:46 (UTC+0)
signal strength 1 of 5
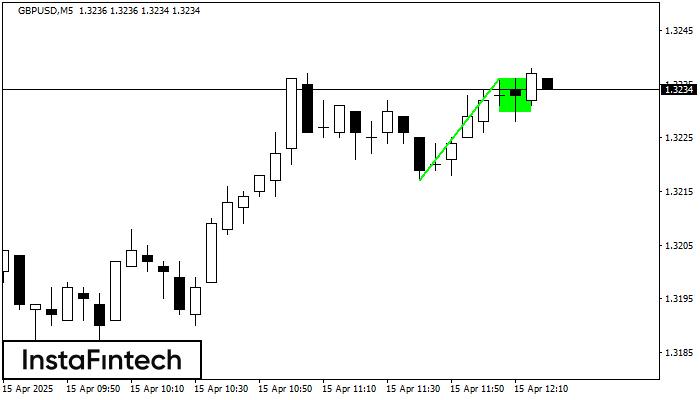
The Bullish Flag pattern which signals continuation of a trend has been formed on the chart GBPUSD M5. Forecast: if the price breaks above the pattern high at 1.3236, then traders will be able to place a long deal with the target at 1.3251.
The M5 and M15 time frames may have more false entry points.
- All
- All
- Bearish Rectangle
- Bearish Symmetrical Triangle
- Bearish Symmetrical Triangle
- Bullish Rectangle
- Double Top
- Double Top
- Triple Bottom
- Triple Bottom
- Triple Top
- Triple Top
- All
- All
- Buy
- Sale
- All
- 1
- 2
- 3
- 4
- 5
Doble Techo
was formed on 22.05 at 15:35:32 (UTC+0)
signal strength 1 of 5
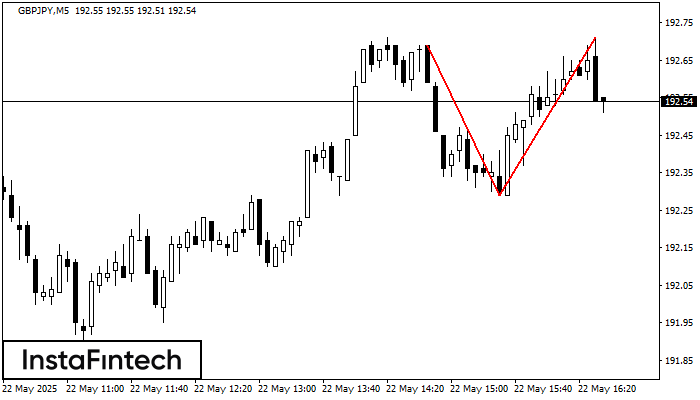
El patrón de reversión Doble Techo ha sido formado en GBPJPY M5. Características: el límite superior 192.69; el límite inferior 192.29; el ancho del patrón es 42 puntos. Es mejor
Los marcos de tiempo M5 y M15 pueden tener más puntos de entrada falsos.
Open chart in a new window
Doble Techo
was formed on 22.05 at 15:30:26 (UTC+0)
signal strength 1 of 5
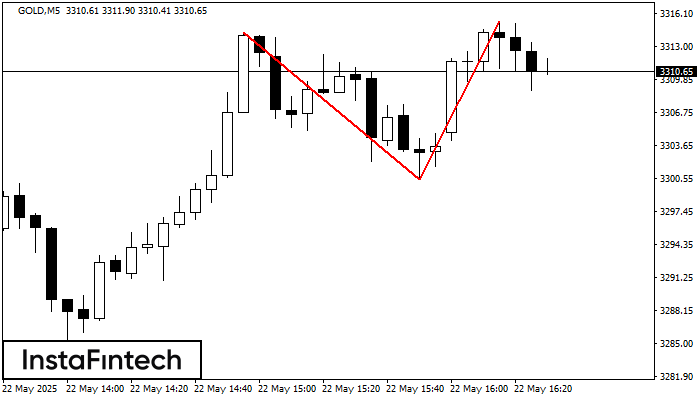
El patrón Doble Techo ha sido formado en GOLD M5. Esto señala que la tendencia ha sido cambiada de alcista a bajista. Probablemente, si la base del patrón 3300.45
Los marcos de tiempo M5 y M15 pueden tener más puntos de entrada falsos.
Open chart in a new window
Banderín alcista
was formed on 22.05 at 15:30:16 (UTC+0)
signal strength 4 of 5
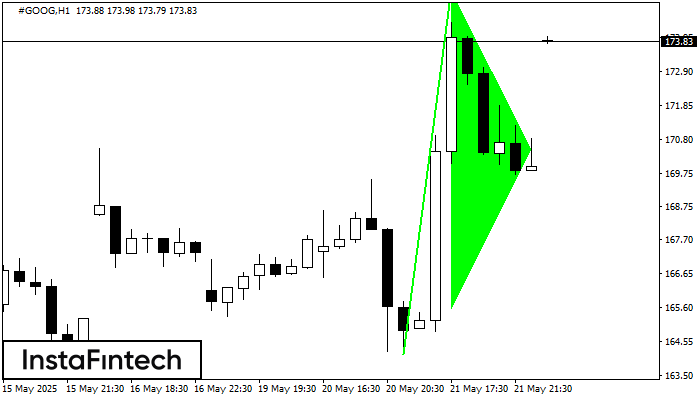
El patrón gráfico Banderín alcista se ha formado en el instrumento #GOOG H1. Este tipo de patrón entra en la categoría de patrones de continuación. En este caso
Open chart in a new window


