

Actual patterns

Patterns are graphical models which are formed in the chart by the price. According to one of the technical analysis postulates, history (price movement) repeats itself. It means that the price movements are often similar in the same situations which makes it possible to predict the further development of the situation with a high probability.
Relevant patterns by InstaTrade is an easy-to-use service which allows you to be aware of latest changes in the market and react to clues from the market in time. In our service you will always find the latest and most relevant patterns on any pair and any timeframe.
Head and Shoulders
was formed on 14.04 at 05:15:40 (UTC+0)
signal strength 1 of 5

According to the chart of M5, EURCAD formed the Head and Shoulders pattern. The Head’s top is set at 1.5811 while the median line of the Neck is found at 1.5747/1.5755. The formation of the Head and Shoulders pattern evidently signals a reversal of the upward trend. In other words, in case the scenario comes true, the price of EURCAD will go towards 1.5740.
The M5 and M15 time frames may have more false entry points.
- All
- All
- Bearish Rectangle
- Bearish Symmetrical Triangle
- Bearish Symmetrical Triangle
- Bullish Rectangle
- Double Top
- Double Top
- Triple Bottom
- Triple Bottom
- Triple Top
- Triple Top
- All
- All
- Buy
- Sale
- All
- 1
- 2
- 3
- 4
- 5
Doble Techo
was formed on 21.05 at 20:30:53 (UTC+0)
signal strength 3 of 5
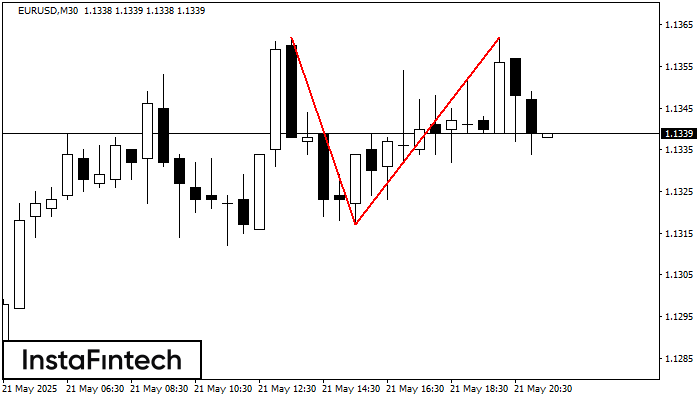
El patrón Doble Techo ha sido formado en EURUSD M30. Esto señala que la tendencia ha sido cambiada de alcista a bajista. Probablemente, si la base del patrón 1.1317
Open chart in a new window
Rectángulo Bajista
was formed on 21.05 at 19:30:17 (UTC+0)
signal strength 4 of 5
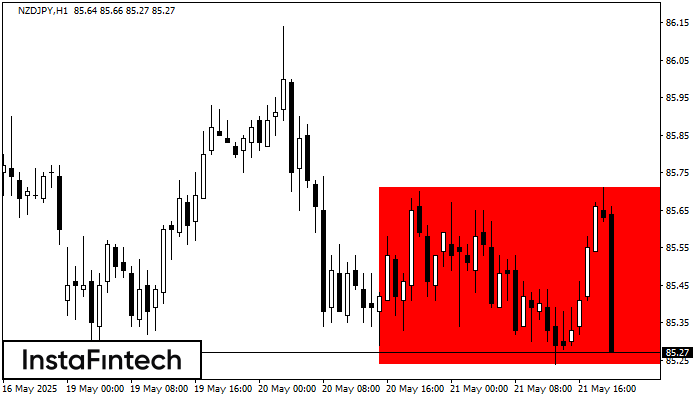
Según el gráfico de H1, NZDJPY formó el Rectángulo Bajista que es un patrón de la continuación de una tendencia. El patrón está contenido dentro de los siguientes límites: límite
Open chart in a new window
Rectángulo Bajista
was formed on 21.05 at 19:27:17 (UTC+0)
signal strength 4 of 5
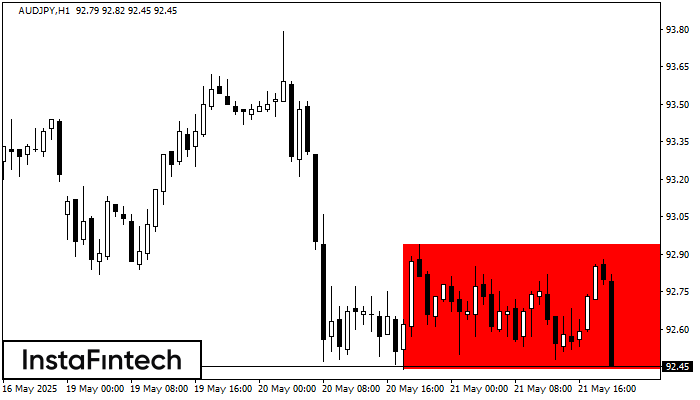
Según el gráfico de H1, AUDJPY formó el Rectángulo Bajista. El patrón indica la continuación de una tendencia. El límite superior es 92.94, el límite inferior es 92.44. La señal
Open chart in a new window


