

Actual patterns

Patterns are graphical models which are formed in the chart by the price. According to one of the technical analysis postulates, history (price movement) repeats itself. It means that the price movements are often similar in the same situations which makes it possible to predict the further development of the situation with a high probability.
Relevant patterns by InstaTrade is an easy-to-use service which allows you to be aware of latest changes in the market and react to clues from the market in time. In our service you will always find the latest and most relevant patterns on any pair and any timeframe.
Double Bottom
was formed on 14.04 at 04:45:49 (UTC+0)
signal strength 1 of 5

The Double Bottom pattern has been formed on NZDCAD M5. This formation signals a reversal of the trend from downwards to upwards. The signal is that a buy trade should be opened after the upper boundary of the pattern 0.8117 is broken. The further movements will rely on the width of the current pattern 42 points.
The M5 and M15 time frames may have more false entry points.
See Also
- All
- All
- Bearish Rectangle
- Bearish Symmetrical Triangle
- Bearish Symmetrical Triangle
- Bullish Rectangle
- Double Top
- Double Top
- Triple Bottom
- Triple Bottom
- Triple Top
- Triple Top
- All
- All
- Buy
- Sale
- All
- 1
- 2
- 3
- 4
- 5
Triángulo Simétrico Alcista
was formed on 22.05 at 08:01:53 (UTC+0)
signal strength 3 of 5

Según el gráfico de M30, EURUSD formó el patrón Triángulo Simétrico Alcista, que señala que la tendencia continuará. Descripción. El límite superior del patrón toca las coordenadas 1.1362/1.1333 donde
Open chart in a new window
Banderín bajista
was formed on 22.05 at 08:00:35 (UTC+0)
signal strength 4 of 5

El patrón Banderín bajista se ha formado en el gráfico NZDCAD H1. El patrón señala la continuación de la tendencia bajista en caso de que se rompa el mínimo
Open chart in a new window
Triple Piso
was formed on 22.05 at 07:26:02 (UTC+0)
signal strength 1 of 5
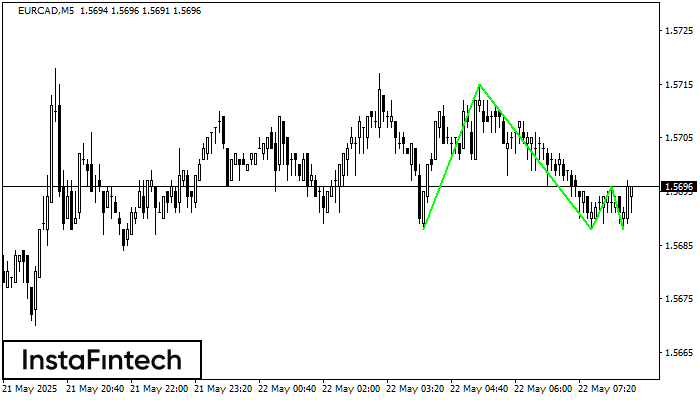
El patrón Triple Piso ha sido formado en el gráfico de EURCAD M5. Características del patrón: línea inferior del patrón tiene coordenadas 1.5715 con el límite superior 1.5715/1.5696, la proyección
Los marcos de tiempo M5 y M15 pueden tener más puntos de entrada falsos.
Open chart in a new window


