

Actual patterns

Patterns are graphical models which are formed in the chart by the price. According to one of the technical analysis postulates, history (price movement) repeats itself. It means that the price movements are often similar in the same situations which makes it possible to predict the further development of the situation with a high probability.
Relevant patterns by InstaTrade is an easy-to-use service which allows you to be aware of latest changes in the market and react to clues from the market in time. In our service you will always find the latest and most relevant patterns on any pair and any timeframe.
Triple Bottom
was formed on 10.04 at 13:10:17 (UTC+0)
signal strength 1 of 5
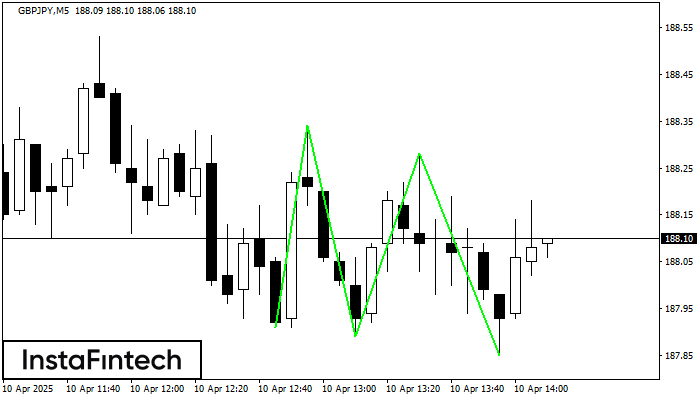
The Triple Bottom pattern has formed on the chart of GBPJPY M5. Features of the pattern: The lower line of the pattern has coordinates 188.34 with the upper limit 188.34/188.28, the projection of the width is 43 points. The formation of the Triple Bottom pattern most likely indicates a change in the trend from downward to upward. This means that in the event of a breakdown of the resistance level 187.91, the price is most likely to continue the upward movement.
The M5 and M15 time frames may have more false entry points.
See Also
- All
- All
- Bearish Rectangle
- Bearish Symmetrical Triangle
- Bearish Symmetrical Triangle
- Bullish Rectangle
- Double Top
- Double Top
- Triple Bottom
- Triple Bottom
- Triple Top
- Triple Top
- All
- All
- Buy
- Sale
- All
- 1
- 2
- 3
- 4
- 5
Doble Techo
was formed on 20.05 at 23:00:03 (UTC+0)
signal strength 3 of 5
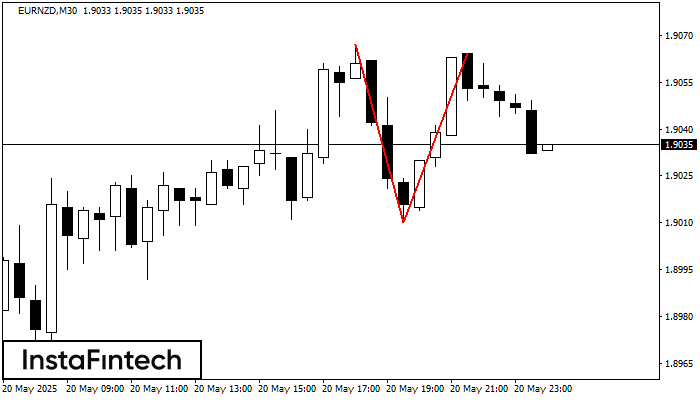
El patrón de reversión Doble Techo ha sido formado en EURNZD M30. Características: el límite superior 1.9067; el límite inferior 1.9010; el ancho del patrón es 54 puntos. Es mejor
Open chart in a new window
Banderín bajista
was formed on 20.05 at 22:42:44 (UTC+0)
signal strength 1 of 5
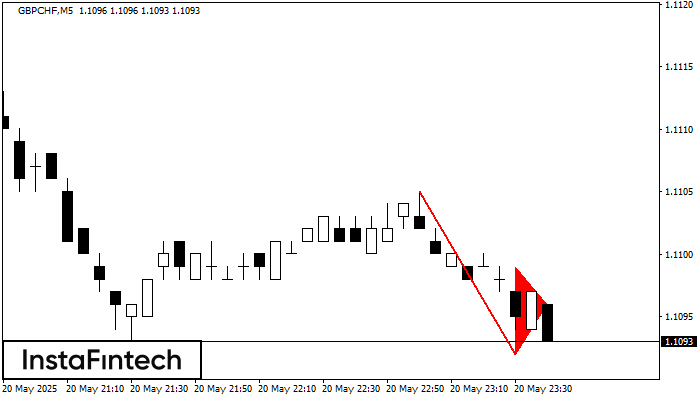
El patrón Banderín bajista se ha formado en el gráfico GBPCHF M5. Esto señala la continuación potencial de la tendencia existente. Especificaciones: el piso del patrón tiene la coordinada
Los marcos de tiempo M5 y M15 pueden tener más puntos de entrada falsos.
Open chart in a new window
Triángulo Simétrico Bajista
was formed on 20.05 at 22:27:29 (UTC+0)
signal strength 1 of 5
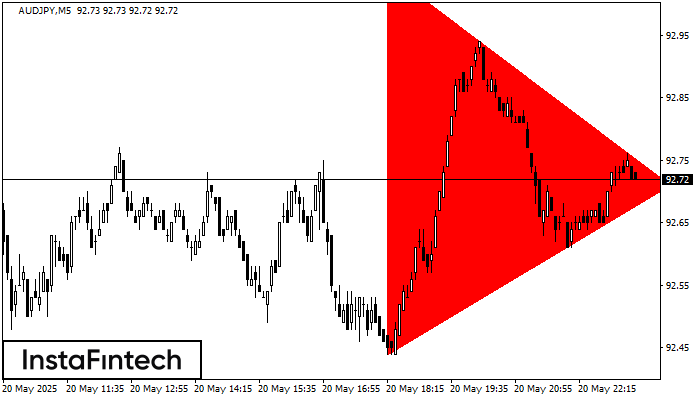
Según el gráfico de M5, el AUDJPY formó el patrón Triángulo Simétrico Bajista. Recomendaciones de negociación: es posible que una ruptura del límite inferior 92.44 fomente una continuación
Los marcos de tiempo M5 y M15 pueden tener más puntos de entrada falsos.
Open chart in a new window


