

Actual patterns

Patterns are graphical models which are formed in the chart by the price. According to one of the technical analysis postulates, history (price movement) repeats itself. It means that the price movements are often similar in the same situations which makes it possible to predict the further development of the situation with a high probability.
Relevant patterns by InstaTrade is an easy-to-use service which allows you to be aware of latest changes in the market and react to clues from the market in time. In our service you will always find the latest and most relevant patterns on any pair and any timeframe.
Triple Bottom
was formed on 04.04 at 10:00:05 (UTC+0)
signal strength 4 of 5
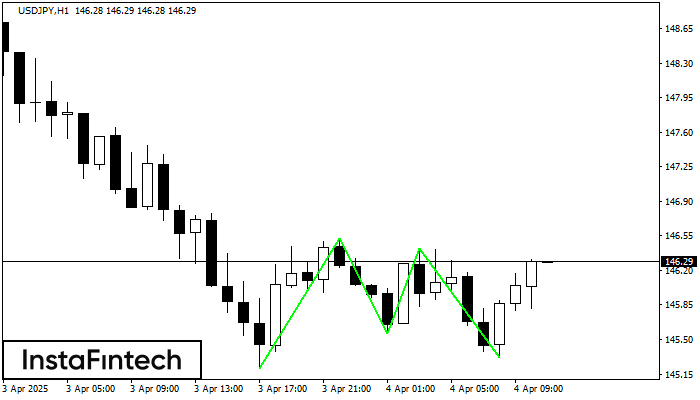
The Triple Bottom pattern has been formed on USDJPY H1. It has the following characteristics: resistance level 146.52/146.42; support level 145.21/145.32; the width is 131 points. In the event of a breakdown of the resistance level of 146.52, the price is likely to continue an upward movement at least to 145.96.
- All
- All
- Bearish Rectangle
- Bearish Symmetrical Triangle
- Bearish Symmetrical Triangle
- Bullish Rectangle
- Double Top
- Double Top
- Triple Bottom
- Triple Bottom
- Triple Top
- Triple Top
- All
- All
- Buy
- Sale
- All
- 1
- 2
- 3
- 4
- 5
Triángulo Simétrico Alcista
was formed on 22.05 at 02:03:55 (UTC+0)
signal strength 1 of 5
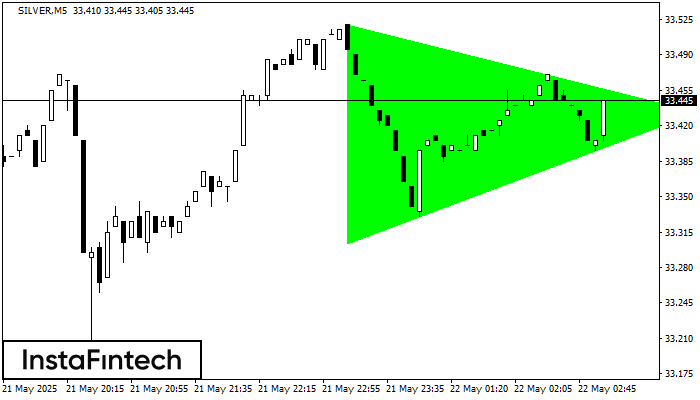
Según el gráfico de M5, SILVER formó el patrón Triángulo Simétrico Alcista, que señala que la tendencia continuará. Descripción. El límite superior del patrón toca las coordenadas 33.52/33.43 donde
Los marcos de tiempo M5 y M15 pueden tener más puntos de entrada falsos.
Open chart in a new window
Triángulo Simétrico Alcista
was formed on 22.05 at 02:03:10 (UTC+0)
signal strength 4 of 5
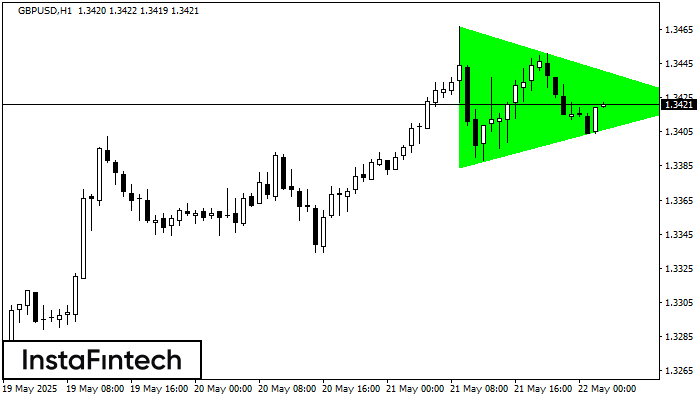
Según el gráfico de H1, GBPUSD formó el patrón Triángulo Simétrico Alcista. Descripción: Este es el patrón de la continuación de una tendencia. 1.3467 y 1.3384 son las coordenadas
Open chart in a new window
Triple Piso
was formed on 22.05 at 02:00:46 (UTC+0)
signal strength 2 of 5
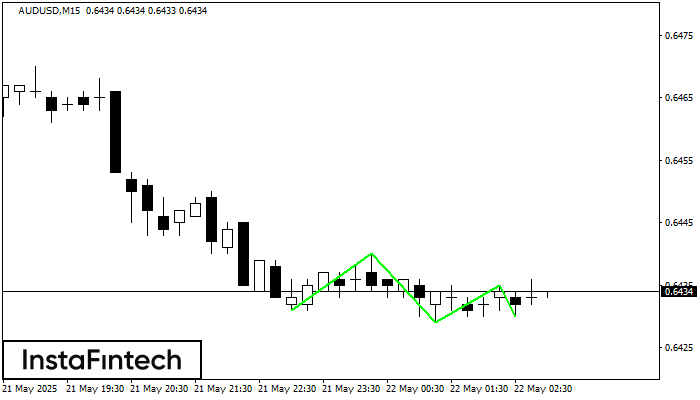
El patrón Triple Piso ha sido formado en AUDUSD M15. Este tiene las siguientes características: nivel de resistencia 0.6440/0.6435; nivel de soporte 0.6431/0.6430; el ancho es 9 puntos. En caso
Los marcos de tiempo M5 y M15 pueden tener más puntos de entrada falsos.
Open chart in a new window


