

Actual patterns

Patterns are graphical models which are formed in the chart by the price. According to one of the technical analysis postulates, history (price movement) repeats itself. It means that the price movements are often similar in the same situations which makes it possible to predict the further development of the situation with a high probability.
Relevant patterns by InstaTrade is an easy-to-use service which allows you to be aware of latest changes in the market and react to clues from the market in time. In our service you will always find the latest and most relevant patterns on any pair and any timeframe.
Triple Bottom
was formed on 31.03 at 13:00:03 (UTC+0)
signal strength 3 of 5
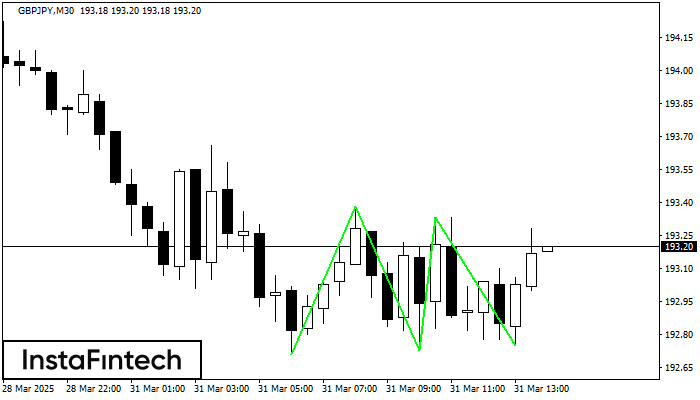
The Triple Bottom pattern has been formed on GBPJPY M30. It has the following characteristics: resistance level 193.38/193.33; support level 192.71/192.75; the width is 67 points. In the event of a breakdown of the resistance level of 193.38, the price is likely to continue an upward movement at least to 193.03.
- All
- All
- Bearish Rectangle
- Bearish Symmetrical Triangle
- Bearish Symmetrical Triangle
- Bullish Rectangle
- Double Top
- Double Top
- Triple Bottom
- Triple Bottom
- Triple Top
- Triple Top
- All
- All
- Buy
- Sale
- All
- 1
- 2
- 3
- 4
- 5
Двойная вершина
сформирован 22.05 в 23:00:29 (UTC+0)
сила сигнала 4 из 5
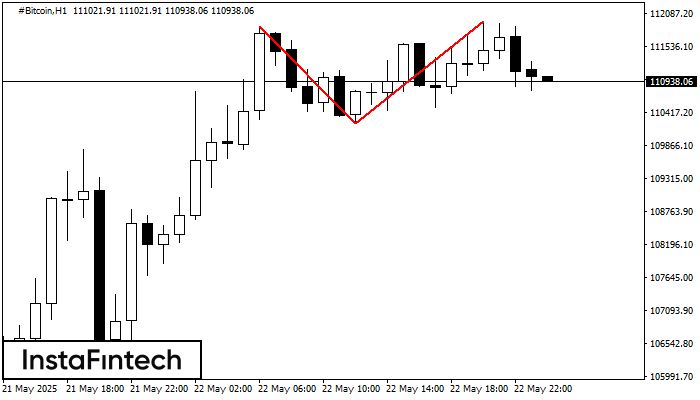
На торговом графике #Bitcoin H1 сформировалась разворотная фигура «Двойная вершина». Характеристика: Верхняя граница 111951.72; Нижняя граница 110239.46; Ширина фигуры 171226 пунктов. Сигнал: Пробой нижней границы 110239.46 приведет к дальнейшему нисходящему
Открыть график инструмента в новом окне
Медвежий симметричный треугольник
сформирован 22.05 в 22:01:48 (UTC+0)
сила сигнала 3 из 5
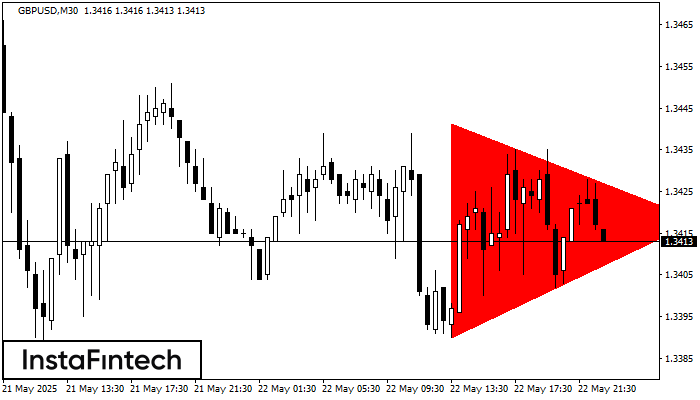
По GBPUSD M30 сформировалась фигура «Медвежий симметричный треугольник». Данная фигура сигнализирует нам о продолжении нисходящего тренда в случае пробоя нижней границы 1.3390, где вероятная прибыль будет являться шириной текущей фигуры
Открыть график инструмента в новом окне
Медвежий симметричный треугольник
сформирован 22.05 в 22:01:15 (UTC+0)
сила сигнала 2 из 5
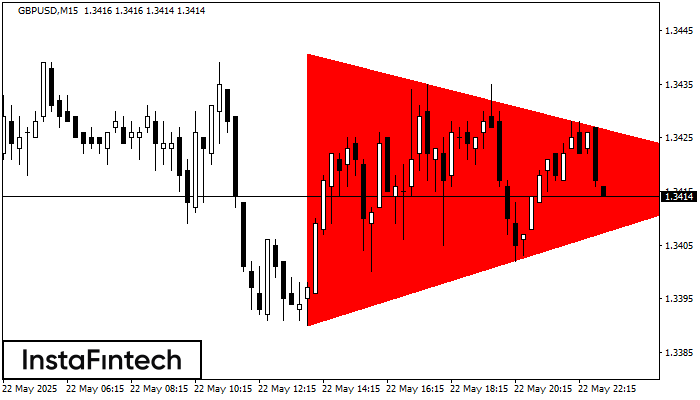
По GBPUSD M15 сформировалась фигура «Медвежий симметричный треугольник». Данная фигура сигнализирует нам о продолжении нисходящего тренда в случае пробоя нижней границы 1.3390, где вероятная прибыль будет являться шириной текущей фигуры
Таймфреймы М5 и М15 могут иметь больше ложных точек входа.
Открыть график инструмента в новом окне


