

Actual patterns

Patterns are graphical models which are formed in the chart by the price. According to one of the technical analysis postulates, history (price movement) repeats itself. It means that the price movements are often similar in the same situations which makes it possible to predict the further development of the situation with a high probability.
Relevant patterns by InstaTrade is an easy-to-use service which allows you to be aware of latest changes in the market and react to clues from the market in time. In our service you will always find the latest and most relevant patterns on any pair and any timeframe.
Triple Top
was formed on 31.03 at 08:30:26 (UTC+0)
signal strength 3 of 5

The Triple Top pattern has formed on the chart of the EURCAD M30. Features of the pattern: borders have an ascending angle; the lower line of the pattern has the coordinates 1.5476/1.5505 with the upper limit 1.5517/1.5519; the projection of the width is 41 points. The formation of the Triple Top figure most likely indicates a change in the trend from upward to downward. This means that in the event of a breakdown of the support level of 1.5476, the price is most likely to continue the downward movement.
See Also
- All
- All
- Bearish Rectangle
- Bearish Symmetrical Triangle
- Bearish Symmetrical Triangle
- Bullish Rectangle
- Double Top
- Double Top
- Triple Bottom
- Triple Bottom
- Triple Top
- Triple Top
- All
- All
- Buy
- Sale
- All
- 1
- 2
- 3
- 4
- 5
Triple Piso
was formed on 22.05 at 07:26:02 (UTC+0)
signal strength 1 of 5
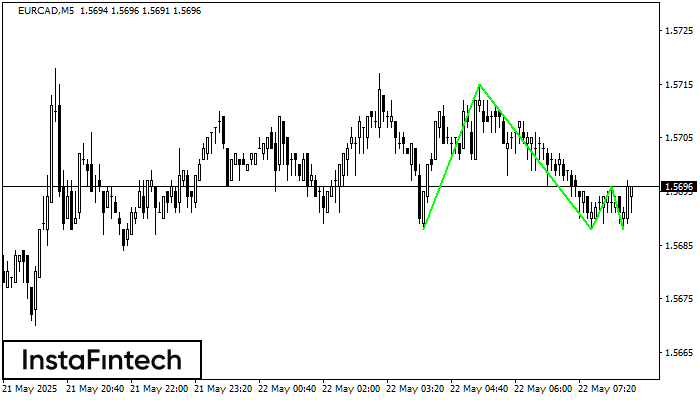
El patrón Triple Piso ha sido formado en el gráfico de EURCAD M5. Características del patrón: línea inferior del patrón tiene coordenadas 1.5715 con el límite superior 1.5715/1.5696, la proyección
Los marcos de tiempo M5 y M15 pueden tener más puntos de entrada falsos.
Open chart in a new window
Doble Piso
was formed on 22.05 at 07:00:31 (UTC+0)
signal strength 4 of 5
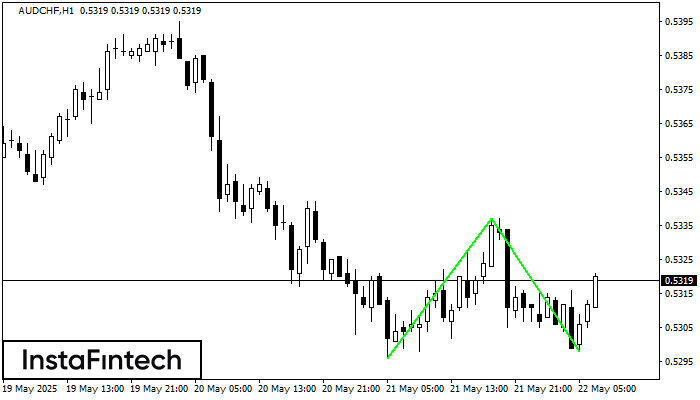
El patrón Doble Piso ha sido formado en AUDCHF H1. Esta formación señala una reversión de la tendencia de bajista a alcista. La señal es que se debe abrir
Open chart in a new window
Doble Piso
was formed on 22.05 at 06:15:30 (UTC+0)
signal strength 2 of 5
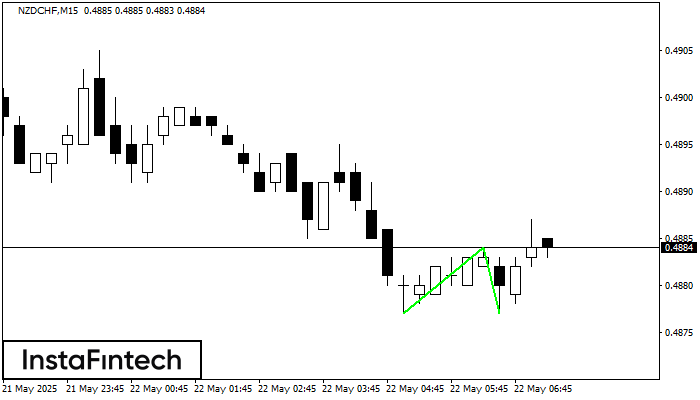
El patrón Doble Piso ha sido formado en NZDCHF M15. Esta formación señala una reversión de la tendencia de bajista a alcista. La señal es que se debe abrir
Los marcos de tiempo M5 y M15 pueden tener más puntos de entrada falsos.
Open chart in a new window


