

Padrões atuais

Padrões são modelos gráficos que são formados no gráfico pelo preço. Segundo um dos postulados da análise técnica, a história (movimento de preços) se repete. Isso significa que os movimentos de preços geralmente são semelhantes nas mesmas situações, o que possibilita prever o desenvolvimento futuro da situação com alta probabilidade.
Os padrões relevantes da InstaTrade são um serviço fácil de usar, que permite que você esteja ciente das últimas mudanças no mercado e reaja a indícios do mercado a tempo. Em nosso serviço, você sempre encontrará os padrões mais recentes e relevantes em qualquer par e em qualquer período gráfico.
Double Bottom
was formed on 09.04 at 12:59:46 (UTC+0)
signal strength 2 of 5
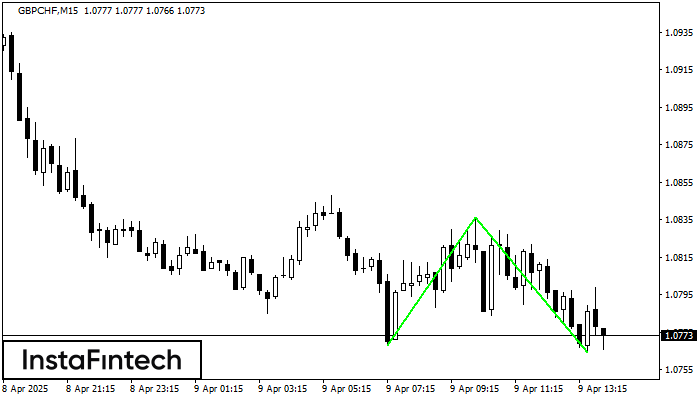
The Double Bottom pattern has been formed on GBPCHF M15; the upper boundary is 1.0836; the lower boundary is 1.0764. The width of the pattern is 68 points. In case of a break of the upper boundary 1.0836, a change in the trend can be predicted where the width of the pattern will coincide with the distance to a possible take profit level.
The M5 and M15 time frames may have more false entry points.
- All
- All
- Bearish Rectangle
- Bearish Symmetrical Triangle
- Bearish Symmetrical Triangle
- Bullish Rectangle
- Double Top
- Double Top
- Triple Bottom
- Triple Bottom
- Triple Top
- Triple Top
- All
- All
- Buy
- Sale
- All
- 1
- 2
- 3
- 4
- 5
ট্রিপল টপ
was formed on 01.06 at 02:15:04 (UTC+0)
signal strength 2 of 5

M15 চার্টে, #Bitcoin ট্রেডিং ইন্সট্রুমেন্টের ট্রিপল টপ প্যাটার্ন প্রবণতা পরিবর্তনের ইঙ্গিত দেয়। তৃতীয় পিকের গঠনের পরে, মূল্য 104215.56-এর রেজিস্ট্যান্স স্তর ভেদ করার প্রচেষ্টা চালানোর সম্ভাবনা রয়েছে, এক্ষেত্রে আমরা সেল করার
M5 এবং M15 টাইম ফ্রেমে আরও ভুল এন্ট্রি পয়েন্ট থাকতে পারে।
Open chart in a new window
ডাবল টপ
was formed on 01.06 at 01:00:35 (UTC+0)
signal strength 3 of 5

M30 চার্টে, #Bitcoin-এর ডাবল টপ রিভার্সাল বা বিপরীতমুখী প্যাটার্ন গঠিত হয়েছে। বৈশিষ্ট্য: উপরের সীমানা 104800.13; নীচের সীমানা 104215.56; প্যাটার্নের প্রস্থ হল 64024 পয়েন্ট। 104215.56 104215.30 স্তরের দিকে সম্ভাব্য মুভমেন্টের সাথে
Open chart in a new window
বুলিশ রেক্ট্যাঙ্গেল
was formed on 31.05 at 19:15:46 (UTC+0)
signal strength 1 of 5

M5 চার্ট অনুসারে, #Bitcoin বুলিশ রেক্ট্যাঙ্গেল গঠন করেছে যা চলমান প্রবণতার ধারাবাহিকতার প্যাটার্ন। প্যাটার্নটি নিম্নলিখিত সীমানার মধ্যে রয়েছে: নীচের সীমানা 104335.43 – 104335.43 এবং উপরের সীমানা 104800.13 – 104800.13৷ উপরের
M5 এবং M15 টাইম ফ্রেমে আরও ভুল এন্ট্রি পয়েন্ট থাকতে পারে।
Open chart in a new window


