

Padrões atuais

Padrões são modelos gráficos que são formados no gráfico pelo preço. Segundo um dos postulados da análise técnica, a história (movimento de preços) se repete. Isso significa que os movimentos de preços geralmente são semelhantes nas mesmas situações, o que possibilita prever o desenvolvimento futuro da situação com alta probabilidade.
Os padrões relevantes da InstaTrade são um serviço fácil de usar, que permite que você esteja ciente das últimas mudanças no mercado e reaja a indícios do mercado a tempo. Em nosso serviço, você sempre encontrará os padrões mais recentes e relevantes em qualquer par e em qualquer período gráfico.
Bullish Rectangle
was formed on 08.04 at 12:56:16 (UTC+0)
signal strength 1 of 5
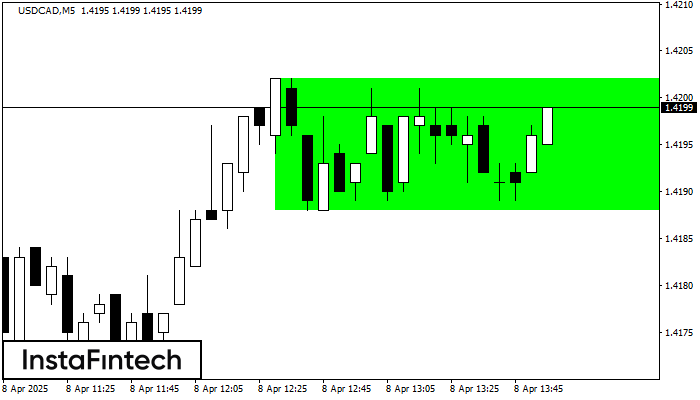
According to the chart of M5, USDCAD formed the Bullish Rectangle which is a pattern of a trend continuation. The pattern is contained within the following borders: the lower border 1.4188 – 1.4188 and upper border 1.4202 – 1.4202. In case the upper border is broken, the instrument is likely to follow the upward trend.
The M5 and M15 time frames may have more false entry points.
Veja também
- All
- All
- Bearish Rectangle
- Bearish Symmetrical Triangle
- Bearish Symmetrical Triangle
- Bullish Rectangle
- Double Top
- Double Top
- Triple Bottom
- Triple Bottom
- Triple Top
- Triple Top
- All
- All
- Buy
- Sale
- All
- 1
- 2
- 3
- 4
- 5
Topo duplo
was formed on 03.06 at 09:00:26 (UTC+0)
signal strength 4 of 5
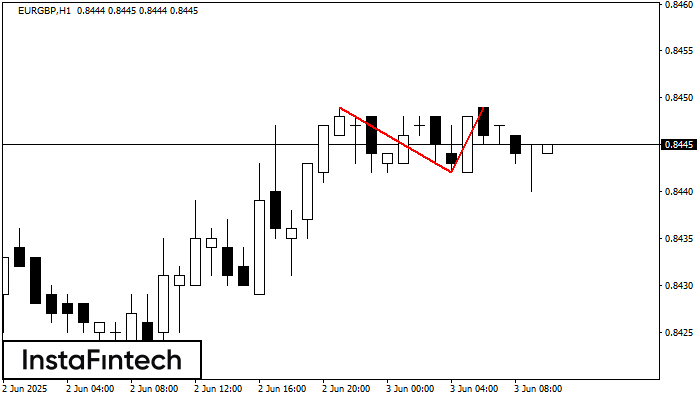
No gráfico de EURGBP H1 o padrão de reversão Topo duplo foi formado. Características: o limite superior 0.8449; o limite inferior 0.8442; a largura do padrão 7 pontos. O sinal
Open chart in a new window
Fundo triplo
was formed on 03.06 at 09:00:20 (UTC+0)
signal strength 1 of 5
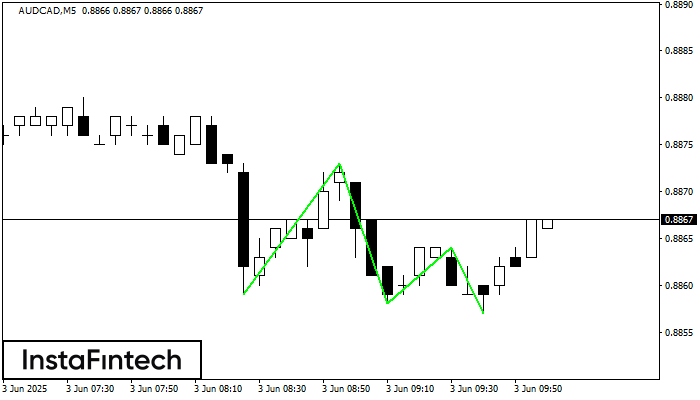
O padrão Fundo triplo foi formado no gráfico de AUDCAD M5. Características do padrão: A linha inferior do padrão tem coordenadas 0.8873 com o limite superior 0.8873/0.8864, a projeção
Os intervalos M5 e M15 podem ter mais pontos de entrada falsos.
Open chart in a new window
Fundo duplo
was formed on 03.06 at 08:45:32 (UTC+0)
signal strength 1 of 5
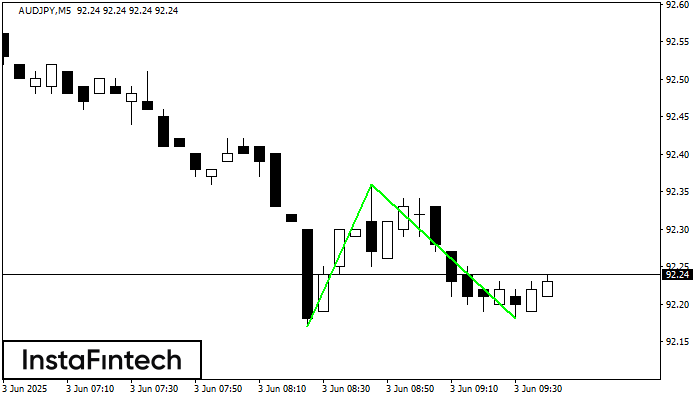
O padrão Fundo duplo foi formado em AUDJPY M5. Características: o nível de suporte 92.17; o nível de resistência 92.36; a largura do padrão 19 pontos. Se o nível
Os intervalos M5 e M15 podem ter mais pontos de entrada falsos.
Open chart in a new window


