

Padrões atuais

Padrões são modelos gráficos que são formados no gráfico pelo preço. Segundo um dos postulados da análise técnica, a história (movimento de preços) se repete. Isso significa que os movimentos de preços geralmente são semelhantes nas mesmas situações, o que possibilita prever o desenvolvimento futuro da situação com alta probabilidade.
Os padrões relevantes da InstaTrade são um serviço fácil de usar, que permite que você esteja ciente das últimas mudanças no mercado e reaja a indícios do mercado a tempo. Em nosso serviço, você sempre encontrará os padrões mais recentes e relevantes em qualquer par e em qualquer período gráfico.
Bullish Symmetrical Triangle
was formed on 08.04 at 08:31:09 (UTC+0)
signal strength 1 of 5
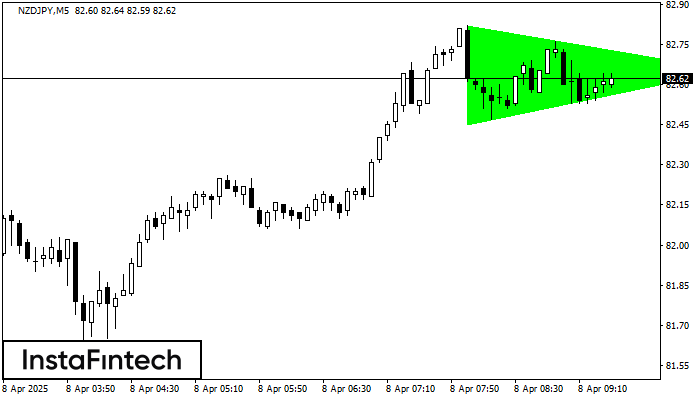
According to the chart of M5, NZDJPY formed the Bullish Symmetrical Triangle pattern. Description: This is the pattern of a trend continuation. 82.82 and 82.45 are the coordinates of the upper and lower borders respectively. The pattern width is measured on the chart at 37 pips. Outlook: If the upper border 82.82 is broken, the price is likely to continue its move by 82.80.
The M5 and M15 time frames may have more false entry points.
Veja também
- All
- All
- Bearish Rectangle
- Bearish Symmetrical Triangle
- Bearish Symmetrical Triangle
- Bullish Rectangle
- Double Top
- Double Top
- Triple Bottom
- Triple Bottom
- Triple Top
- Triple Top
- All
- All
- Buy
- Sale
- All
- 1
- 2
- 3
- 4
- 5
Fundo duplo
was formed on 21.11 at 10:59:55 (UTC+0)
signal strength 3 of 5

O padrão Fundo duplo foi formado em NZDCHF M30. Características: o nível de suporte 0.4493; o nível de resistência 0.4505; a largura do padrão 12 pontos. Se o nível
Open chart in a new window
Cabeça & Ombro Invertidos
was formed on 21.11 at 10:59:55 (UTC+0)
signal strength 3 of 5
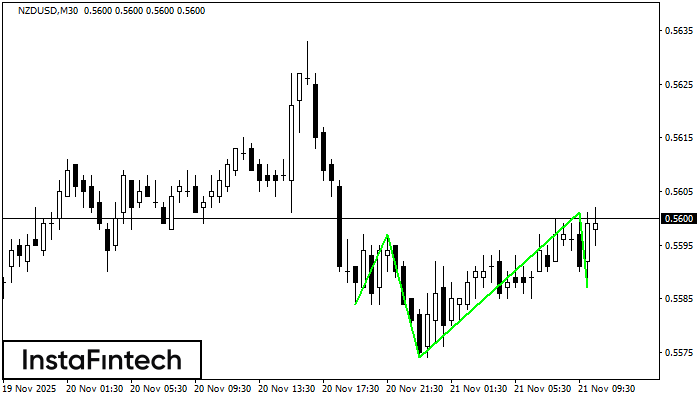
De acordo com o gráfico de M30, NZDUSD formou o padrão Cabeça & Ombro Invertidos. O topo da Cabeça é definido em 0.5601 enquanto a linha mediana do Pescoço
Open chart in a new window
Retângulo de baixa
was formed on 21.11 at 09:45:42 (UTC+0)
signal strength 2 of 5
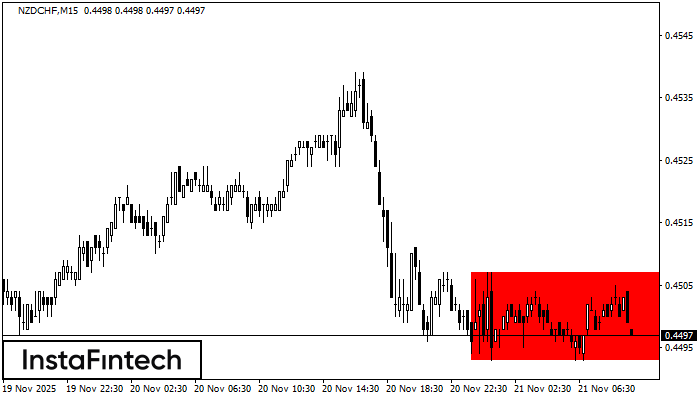
De acordo com o gráfico de M15, NZDCHF formou Retângulo de baixa. O padrão indica uma continuação da tendência. O limite superior é 0.4507, o limite inferior é 0.4493
Os intervalos M5 e M15 podem ter mais pontos de entrada falsos.
Open chart in a new window


