

Padrões atuais

Padrões são modelos gráficos que são formados no gráfico pelo preço. Segundo um dos postulados da análise técnica, a história (movimento de preços) se repete. Isso significa que os movimentos de preços geralmente são semelhantes nas mesmas situações, o que possibilita prever o desenvolvimento futuro da situação com alta probabilidade.
Os padrões relevantes da InstaTrade são um serviço fácil de usar, que permite que você esteja ciente das últimas mudanças no mercado e reaja a indícios do mercado a tempo. Em nosso serviço, você sempre encontrará os padrões mais recentes e relevantes em qualquer par e em qualquer período gráfico.
Bearish Symmetrical Triangle
was formed on 04.04 at 02:33:14 (UTC+0)
signal strength 2 of 5
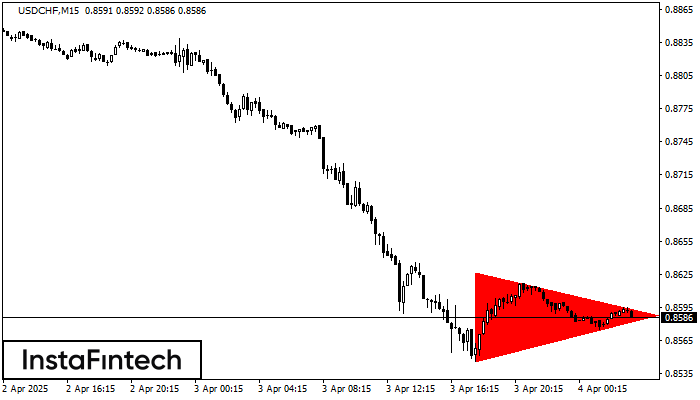
According to the chart of M15, USDCHF formed the Bearish Symmetrical Triangle pattern. This pattern signals a further downward trend in case the lower border 0.8546 is breached. Here, a hypothetical profit will equal the width of the available pattern that is -80 pips.
The M5 and M15 time frames may have more false entry points.
- All
- All
- Bearish Rectangle
- Bearish Symmetrical Triangle
- Bearish Symmetrical Triangle
- Bullish Rectangle
- Double Top
- Double Top
- Triple Bottom
- Triple Bottom
- Triple Top
- Triple Top
- All
- All
- Buy
- Sale
- All
- 1
- 2
- 3
- 4
- 5
Retângulo de baixa
was formed on 28.04 at 20:16:55 (UTC+0)
signal strength 1 of 5
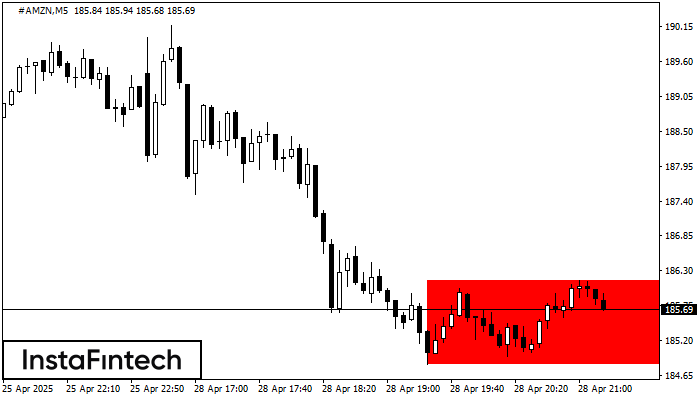
De acordo com o gráfico de M5, #AMZN formou Retângulo de baixa. O padrão indica uma continuação da tendência. O limite superior é 186.15, o limite inferior é 184.83
Os intervalos M5 e M15 podem ter mais pontos de entrada falsos.
Open chart in a new window
Fundo duplo
was formed on 28.04 at 20:15:27 (UTC+0)
signal strength 2 of 5
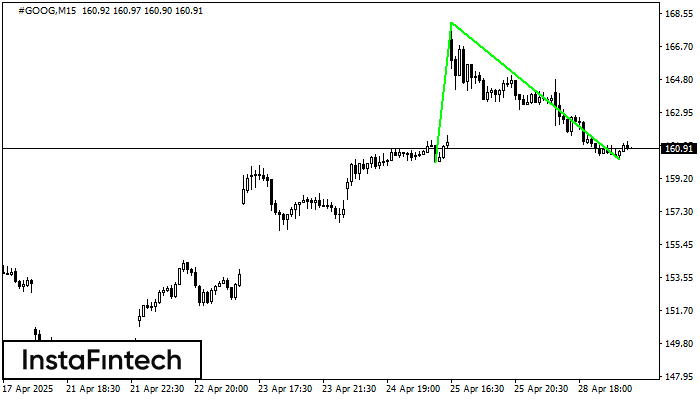
O padrão Fundo duplo foi formado em #GOOG M15. Características: o nível de suporte 160.09; o nível de resistência 168.07; a largura do padrão 798 pontos. Se o nível
Os intervalos M5 e M15 podem ter mais pontos de entrada falsos.
Open chart in a new window
Retângulo de baixa
was formed on 28.04 at 20:10:35 (UTC+0)
signal strength 1 of 5
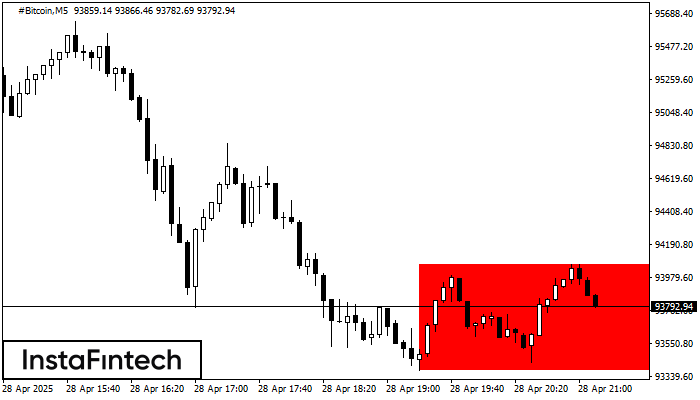
De acordo com o gráfico de M5, #Bitcoin formou Retângulo de baixa que é um padrão de uma continuação de tendência. O padrão está dentro dos seguintes limites: limite inferior
Os intervalos M5 e M15 podem ter mais pontos de entrada falsos.
Open chart in a new window


