

Padrões atuais

Padrões são modelos gráficos que são formados no gráfico pelo preço. Segundo um dos postulados da análise técnica, a história (movimento de preços) se repete. Isso significa que os movimentos de preços geralmente são semelhantes nas mesmas situações, o que possibilita prever o desenvolvimento futuro da situação com alta probabilidade.
Os padrões relevantes da InstaTrade são um serviço fácil de usar, que permite que você esteja ciente das últimas mudanças no mercado e reaja a indícios do mercado a tempo. Em nosso serviço, você sempre encontrará os padrões mais recentes e relevantes em qualquer par e em qualquer período gráfico.
Inverse Head and Shoulder
was formed on 29.03 at 22:00:17 (UTC+0)
signal strength 2 of 5

According to the chart of M15, #Bitcoin produced the pattern termed the Inverse Head and Shoulder. The Head is fixed at 81609.29 while the median line of the Neck is set at 82839.07/82640.15. The formation of the Inverse Head and Shoulder Pattern clearly indicates a reversal of the downward trend. In means that in case the scenario comes true, the price of #Bitcoin will go towards 82640.38.
The M5 and M15 time frames may have more false entry points.
Veja também
- All
- All
- Bearish Rectangle
- Bearish Symmetrical Triangle
- Bearish Symmetrical Triangle
- Bullish Rectangle
- Double Top
- Double Top
- Triple Bottom
- Triple Bottom
- Triple Top
- Triple Top
- All
- All
- Buy
- Sale
- All
- 1
- 2
- 3
- 4
- 5
Triângulo Simétrico de Baixa
was formed on 17.04 at 23:21:25 (UTC+0)
signal strength 1 of 5
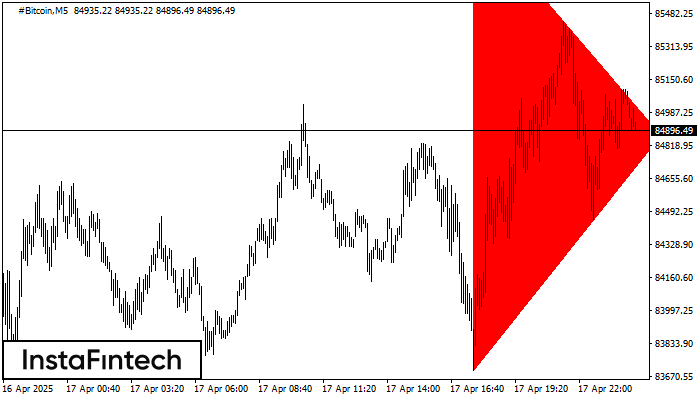
De acordo com o gráfico de M5, #Bitcoin formou o padrão Triângulo Simétrico de Baixa. Descrição: o limite inferior é 83699.27/84872.69 e o limite superior é 85969.60/84872.69. A largura
Os intervalos M5 e M15 podem ter mais pontos de entrada falsos.
Open chart in a new window
Fundo triplo
was formed on 17.04 at 23:00:34 (UTC+0)
signal strength 2 of 5
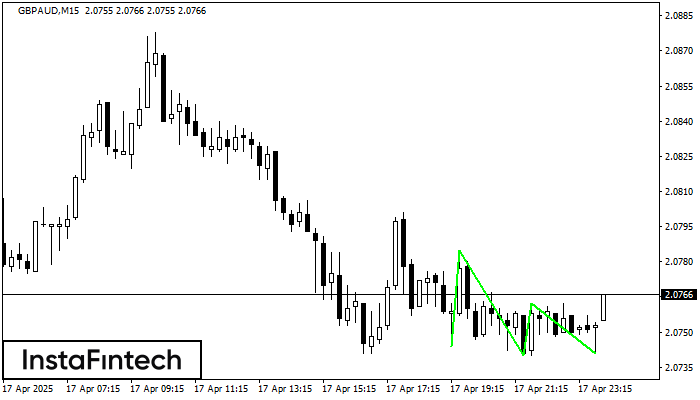
O padrão Fundo triplo foi formado no gráfico do instrumento de negociação GBPAUD M15. O padrão sinaliza uma mudança na tendência de baixa para alta no caso de quebra
Os intervalos M5 e M15 podem ter mais pontos de entrada falsos.
Open chart in a new window
Topo triplo
was formed on 17.04 at 23:00:24 (UTC+0)
signal strength 2 of 5
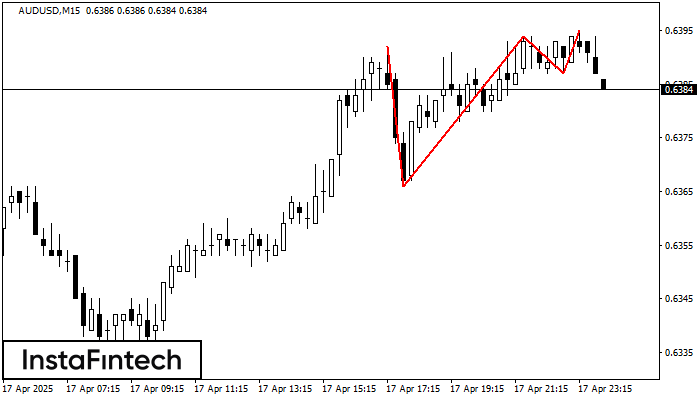
O padrão Topo triplo foi formado no gráfico do instrumento de negociação AUDUSD M15. É um padrão de reversão com as seguintes características: nível de resistência -3, nível de suporte
Os intervalos M5 e M15 podem ter mais pontos de entrada falsos.
Open chart in a new window


