


Padrões são modelos gráficos que são formados no gráfico pelo preço. Segundo um dos postulados da análise técnica, a história (movimento de preços) se repete. Isso significa que os movimentos de preços geralmente são semelhantes nas mesmas situações, o que possibilita prever o desenvolvimento futuro da situação com alta probabilidade.
Os padrões relevantes da InstaTrade são um serviço fácil de usar, que permite que você esteja ciente das últimas mudanças no mercado e reaja a indícios do mercado a tempo. Em nosso serviço, você sempre encontrará os padrões mais recentes e relevantes em qualquer par e em qualquer período gráfico.
Triple Top
was formed on 28.03 at 01:30:25 (UTC+0)
signal strength 3 of 5
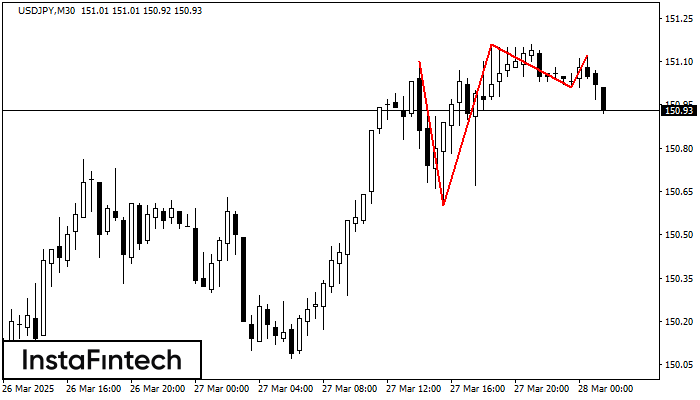
The Triple Top pattern has formed on the chart of the USDJPY M30 trading instrument. It is a reversal pattern featuring the following characteristics: resistance level -2, support level -41, and pattern’s width 50. Forecast If the price breaks through the support level 150.60, it is likely to move further down to 150.86.


