

Padrões atuais

Padrões são modelos gráficos que são formados no gráfico pelo preço. Segundo um dos postulados da análise técnica, a história (movimento de preços) se repete. Isso significa que os movimentos de preços geralmente são semelhantes nas mesmas situações, o que possibilita prever o desenvolvimento futuro da situação com alta probabilidade.
Os padrões relevantes da InstaTrade são um serviço fácil de usar, que permite que você esteja ciente das últimas mudanças no mercado e reaja a indícios do mercado a tempo. Em nosso serviço, você sempre encontrará os padrões mais recentes e relevantes em qualquer par e em qualquer período gráfico.
Bullish Flag
was formed on 19.02 at 15:35:37 (UTC+0)
signal strength 3 of 5
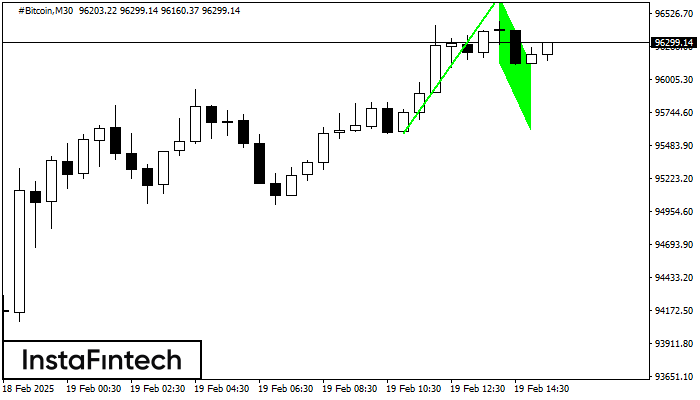
The Bullish Flag pattern has been formed on #Bitcoin at M30. The lower boundary of the pattern is located at 96134.47/95596.99, while the higher boundary lies at 96666.01/96128.53. The projection of the flagpole is 109249 points. This formation signals that the upward trend is most likely to continue. Therefore, if the level of 96666.01 is broken, the price will move further upwards.
Veja também
- All
- All
- Bearish Rectangle
- Bearish Symmetrical Triangle
- Bearish Symmetrical Triangle
- Bullish Rectangle
- Double Top
- Double Top
- Triple Bottom
- Triple Bottom
- Triple Top
- Triple Top
- All
- All
- Buy
- Sale
- All
- 1
- 2
- 3
- 4
- 5
Retângulo de alta
was formed on 11.04 at 21:17:48 (UTC+0)
signal strength 1 of 5
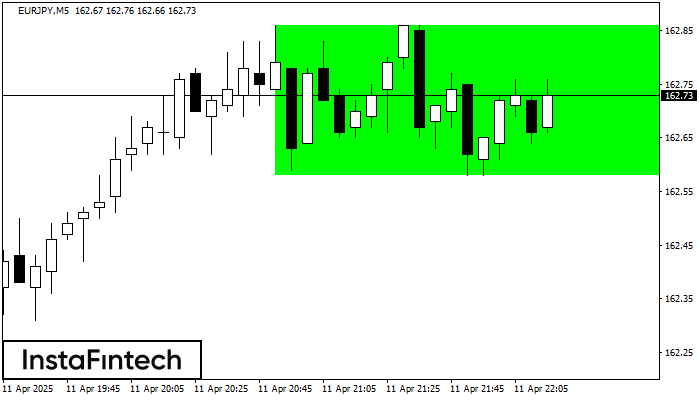
De acordo com o gráfico de M5, EURJPY formou o Retângulo de alta que é um padrão de uma continuação da tendência. O padrão está dentro dos seguintes limites
Os intervalos M5 e M15 podem ter mais pontos de entrada falsos.
Open chart in a new window
Fundo triplo
was formed on 11.04 at 21:15:25 (UTC+0)
signal strength 2 of 5
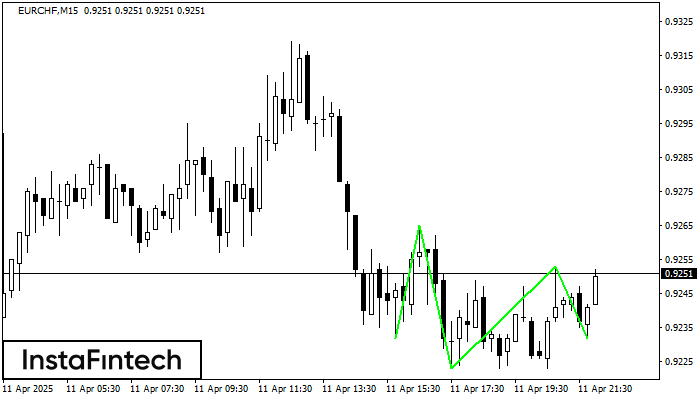
O padrão Fundo triplo foi formado em EURCHF M15. Possui as seguintes características: nível de resistência 0.9265/0.9253; nível de suporte 0.9232/0.9232; a largura é de 33 pontos. Se houver
Os intervalos M5 e M15 podem ter mais pontos de entrada falsos.
Open chart in a new window
Fundo triplo
was formed on 11.04 at 21:00:25 (UTC+0)
signal strength 1 of 5
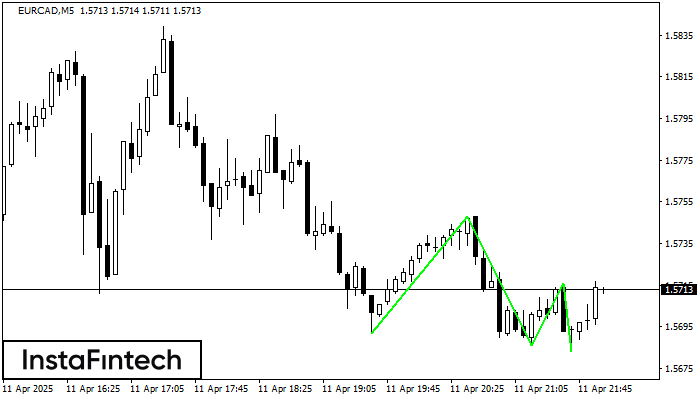
O padrão Fundo triplo foi formado no gráfico de EURCAD M5. Características do padrão: A linha inferior do padrão tem coordenadas 1.5748 com o limite superior 1.5748/1.5716, a projeção
Os intervalos M5 e M15 podem ter mais pontos de entrada falsos.
Open chart in a new window


