empty
14.03.2025 04:25 PM
GBP/USD: Trading Plan for the U.S. Session on March 14th (Review of Morning Trades)

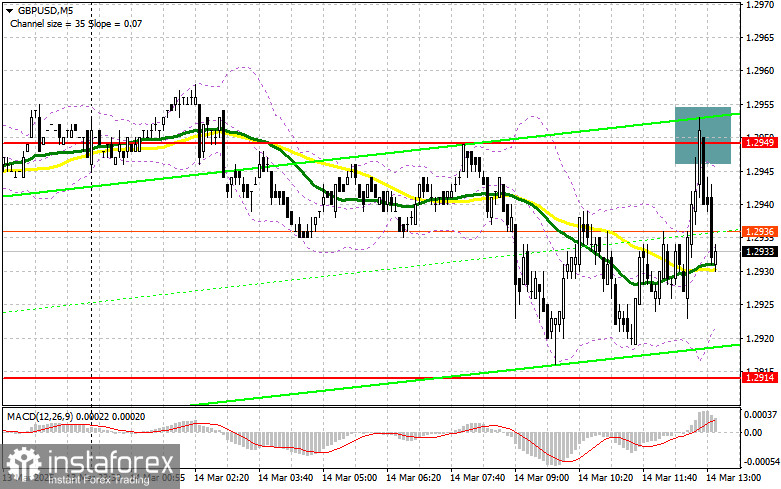
In my morning forecast, I focused on the 1.2949 level and planned to base my trading decisions on it. Let's examine the 5-minute chart to see what happened. A rise followed by a false breakout at 1.2949 provided a good selling opportunity, leading to a 20-point decline in the pair. The technical outlook remains unchanged for the second half of the day.

This image is no longer relevant

To Open Long Positions on GBP/USD:

The British pound showed only a slight decline following news that UK GDP contracted in January and came in below economists' expectations. However, this downward move wasn't enough to push the pair out of its trading range, meaning that market focus has now shifted to U.S. data.

The University of Michigan Consumer Sentiment Index and inflation expectations may put pressure on the U.S. dollar if the data comes in weaker than expected, potentially helping GBP/USD continue its upward movement.

I will stick to the morning scenario and look for buying opportunities from the nearest support at 1.2914. A false breakout at this level will provide a good long entry point, targeting a recovery toward resistance at 1.2949, where the pair is currently trading. A break and retest of this range from above will confirm a strong buy entry, with an upward target of 1.2984, signaling a return to a bullish market. The ultimate target will be 1.3028, where I plan to take profits.

If GBP/USD declines and fails to find buyers around 1.2914, selling pressure on the pound will increase, potentially triggering a stronger sell-off. In this case, I will consider buying only after a false breakout near the 1.2876 low. If the pair drops further, I will open long positions on a rebound from 1.2841, targeting a 30-35 point intraday upward correction.

To Open Short Positions on GBP/USD:

Sellers took advantage of weak GDP data, but even this was not enough to trigger a significant decline, suggesting that there is little interest in selling the pound at current levels.

The main focus in the second half of the day will remain on defending resistance at 1.2949. A false breakout at this level, similar to the morning scenario, will provide a good short entry point, targeting a correction toward 1.2914. A break and retest of this level from below will lead to stop-loss triggers, potentially pushing the pair lower to 1.2876, which would be a significant correction. The ultimate bearish target is 1.2841, where I plan to take profits. A test of this level may temporarily halt the pound's upward trend.

If demand for the pound remains strong in the second half of the day and bears fail to act around 1.2949, I will postpone selling until the next resistance at 1.2984. I will sell only after a false breakout at this level. If there is no downward reaction, I will consider short positions on a rebound from 1.3028, targeting a 30-35 point downward correction.

This image is no longer relevant

Commitments of Traders (COT) Report:

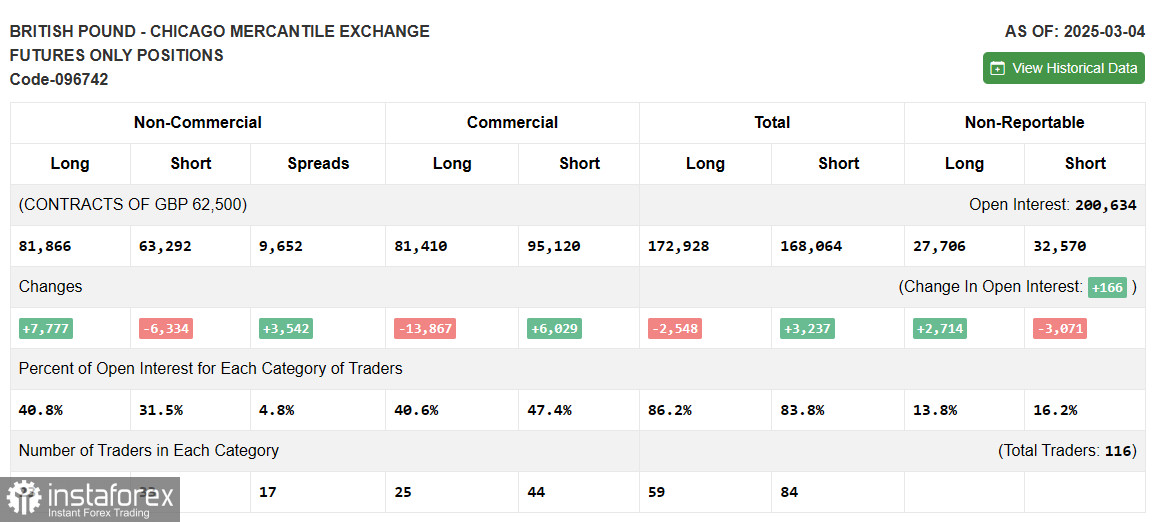
The COT report for March 4 showed a minimal increase in long positions and a reduction in short positions. The growing dominance of buyers suggests that GBP/USD may continue its upward movement.

Considering positive trends in the UK economy and the Bank of England's gradual approach to rate cuts, the pound may continue to strengthen. However, traders should remain cautious about potential corrections, which could occur before new local highs are reached.

The latest COT report indicated that long non-commercial positions increased by 7,777 to 81,866, while short non-commercial positions declined by 6,334 to 63,292. As a result, the gap between long and short positions widened by 3,542.

This image is no longer relevant

Indicator Signals:

Moving Averages:

Trading is taking place around the 30-day and 50-day moving averages, indicating a sideways market trend.

Note: The periods and prices of moving averages analyzed by the author are based on the H1 chart and differ from the standard daily moving averages on the D1 chart.

Bollinger Bands:

If GBP/USD declines, the lower boundary of the indicator around 1.2914 will act as support.

Indicator Descriptions:

  • Moving Average (MA): Identifies the current trend by smoothing out volatility and noise.
    • 50-period MA (yellow on the chart)
    • 30-period MA (green on the chart)
  • MACD (Moving Average Convergence/Divergence):
    • Fast EMA – 12-period
    • Slow EMA – 26-period
    • SMA – 9-period
  • Bollinger Bands: 20-period
  • Non-commercial traders: Speculators, including individual traders, hedge funds, and large institutions using the futures market for speculative purposes.
  • Long non-commercial positions: The total long open positions held by non-commercial traders.
  • Short non-commercial positions: The total short open positions held by non-commercial traders.
  • Net non-commercial position: The difference between short and long positions among non-commercial traders.
Miroslaw Bawulski,
Analytical expert of InstaTrade
© 2007-2025

Recommended Stories

EUR/USD: Plano de Negociação para a sessão europeia de 21 de julho. Relatórios de Compromisso dos Comerciantes (COT) (Análise das Negociações de Ontem). Correção do euro está perto do fim

EUR/USD: Plano de Negociação para a sessão europeia de 21 de julho. Relatórios de Compromisso dos Comerciantes (COT) (Análise das Negociações de Ontem). Correção do euro está perto

Miroslaw Bawulski 17:58 2025-07-21 UTC+2

How to Trade GBP/USD on July 11h? Simple Tips and Trade Analysis for Beginners

Na quinta-feira, o par GBP/USD manteve sua trajetória de queda, espelhando o comportamento do EUR/USD. O movimento dessas duas principais paridades cambiais tem sido praticamente idêntico ao longo da semana

Paolo Greco 17:34 2025-07-11 UTC+2

Como negociar EUR/USD em 11 de julho? Dicas simples e análise de negociação para iniciantes

Na quinta-feira, o par EUR/USD manteve seu movimento de queda moderado, em linha com a tendência atual. Temos reiterado essa mesma avaliação ao longo da semana porque, de fato, pouca

Paolo Greco 16:28 2025-07-11 UTC+2

O par de moedas EUR/USD foi negociado em baixa na segunda-feira, com o dólar americano mostrando uma força notável

Análise das negociações de segunda-feira: EUR/USD, Gráfico 1H Na segunda-feira, o par EUR/USD operou com viés de baixa, e o dólar norte-americano registrou um ganho relativamente forte. Como já mencionamos

Paolo Greco 16:13 2025-07-08 UTC+2

GBP/USD: Plano de Negociação para a Sessão dos E.U.A. de 7 de julho (Revisão das Negociações da Manhã)

Na minha previsão da manhã, destaquei o nível 1,3602 e planejei usá-lo para determinar os pontos de entrada no mercado. Vamos dar uma olhada no gráfico de 5 minutos

Miroslaw Bawulski 17:53 2025-07-07 UTC+2

EUR/USD: Plano de Negociação para a Sessão dos E.U. de 7 de julho (Revisão das Negociações da Manhã)

Na minha previsão da manhã, destaquei o nível 1,1749 e planejei basear as decisões de entrada no mercado em torno dele. Vamos dar uma olhada no gráfico de 5 minutos

Miroslaw Bawulski 17:44 2025-07-07 UTC+2

Como negociar o par EUR/USD em 4 de julho? Dicas simples e análise de negociação para iniciantes

Análise das operações de quinta-feira Gráfico 1H do EUR/USD O EUR/USD operou de forma estável ao longo da quinta-feira, tanto antes quanto depois da divulgação dos dados de emprego

Paolo Greco 14:57 2025-07-04 UTC+2

GBP/USD: Plano de Negociação para a Sessão dos E.U.A de 1º de julho (Revisão das Negociações da Manhã)

Na minha previsão da manhã, concentrei-me no nível 1,3766 e planejei tomar decisões de negociação a partir desse ponto. Vamos dar uma olhada no gráfico de 5 minutos

Miroslaw Bawulski 20:44 2025-07-01 UTC+2

EUR/USD: Plano de Negociação para a Sessão dos E.U. de 1º de julho (Revisão das Negociações da Manhã)

Na minha previsão da manhã, destaquei o nível de 1,1806 como ponto de referência para tomadas de decisão nas operações. Vamos dar uma olhada no gráfico de 5 minutos

Miroslaw Bawulski 20:24 2025-07-01 UTC+2
Não pode falar agora?
Faça sua pergunta no chat.
 

Dear visitor,

Your IP address shows that you are currently located in the USA. If you are a resident of the United States, you are prohibited from using the services of InstaFintech Group including online trading, online transfers, deposit/withdrawal of funds, etc.

If you think you are seeing this message by mistake and your location is not the US, kindly proceed to the website. Otherwise, you must leave the website in order to comply with government restrictions.

Why does your IP address show your location as the USA?

  • - you are using a VPN provided by a hosting company based in the United States;
  • - your IP does not have proper WHOIS records;
  • - an error occurred in the WHOIS geolocation database.

Please confirm whether you are a US resident or not by clicking the relevant button below. If you choose the wrong option, being a US resident, you will not be able to open an account with InstaTrade anyway.

We are sorry for any inconvenience caused by this message.