

Actual patterns

Patterns are graphical models which are formed in the chart by the price. According to one of the technical analysis postulates, history (price movement) repeats itself. It means that the price movements are often similar in the same situations which makes it possible to predict the further development of the situation with a high probability.
Relevant patterns by InstaTrade is an easy-to-use service which allows you to be aware of latest changes in the market and react to clues from the market in time. In our service you will always find the latest and most relevant patterns on any pair and any timeframe.
Bullish Symmetrical Triangle
was formed on 09.04 at 23:31:08 (UTC+0)
signal strength 1 of 5
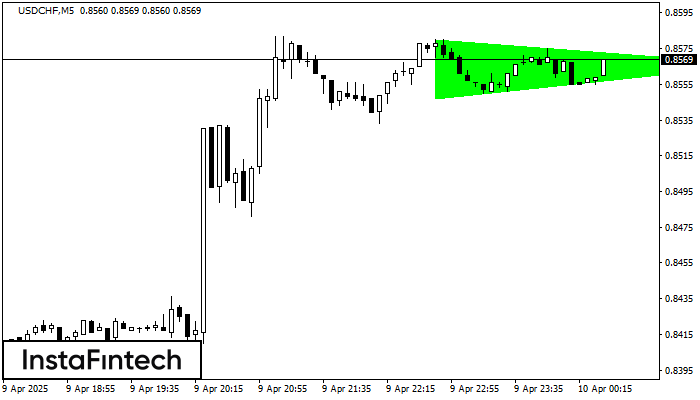
According to the chart of M5, USDCHF formed the Bullish Symmetrical Triangle pattern. Description: This is the pattern of a trend continuation. 0.8580 and 0.8547 are the coordinates of the upper and lower borders respectively. The pattern width is measured on the chart at 33 pips. Outlook: If the upper border 0.8580 is broken, the price is likely to continue its move by 0.8581.
The M5 and M15 time frames may have more false entry points.
- All
- All
- Bearish Rectangle
- Bearish Symmetrical Triangle
- Bearish Symmetrical Triangle
- Bullish Rectangle
- Double Top
- Double Top
- Triple Bottom
- Triple Bottom
- Triple Top
- Triple Top
- All
- All
- Buy
- Sale
- All
- 1
- 2
- 3
- 4
- 5
Двойная вершина
сформирован 07.06 в 11:00:16 (UTC+0)
сила сигнала 3 из 5

По #Bitcoin на M30 сформировалась разворотная фигура «Двойная вершина». Характеристика: Верхняя граница 105283.16; Нижняя граница 103816.55; Ширина фигуры 147353 пунктов. Позицию на продажу возможно открыть ниже нижней границы 103816.55
Открыть график инструмента в новом окне
Двойная вершина
сформирован 06.06 в 22:30:10 (UTC+0)
сила сигнала 2 из 5

На торговом графике USDCAD M15 сформировалась разворотная фигура «Двойная вершина». Характеристика: Верхняя граница 1.3702; Нижняя граница 1.3668; Ширина фигуры 34 пунктов. Сигнал: Пробой нижней границы 1.3668 приведет к дальнейшему нисходящему
Таймфреймы М5 и М15 могут иметь больше ложных точек входа.
Открыть график инструмента в новом окне
Бычий симметричный треугольник
сформирован 06.06 в 22:18:11 (UTC+0)
сила сигнала 2 из 5

По AUDJPY на M15 сформировалась фигура «Бычий симметричный треугольник». Нижняя граница фигуры имеет координаты 93.96/94.02, при этом верхняя граница 94.07/94.02. Формирование фигуры «Бычий симметричный треугольник» наиболее вероятным образом свидетельствует
Таймфреймы М5 и М15 могут иметь больше ложных точек входа.
Открыть график инструмента в новом окне


