

Actual patterns

Patterns are graphical models which are formed in the chart by the price. According to one of the technical analysis postulates, history (price movement) repeats itself. It means that the price movements are often similar in the same situations which makes it possible to predict the further development of the situation with a high probability.
Relevant patterns by InstaTrade is an easy-to-use service which allows you to be aware of latest changes in the market and react to clues from the market in time. In our service you will always find the latest and most relevant patterns on any pair and any timeframe.
Bullish Flag
was formed on 05.03 at 13:00:39 (UTC+0)
signal strength 3 of 5
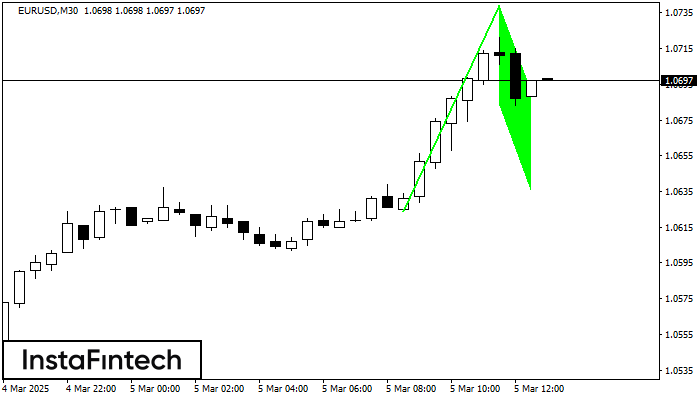
The Bullish Flag pattern has been formed on EURUSD at M30. The lower boundary of the pattern is located at 1.0683/1.0635, while the higher boundary lies at 1.0739/1.0691. The projection of the flagpole is 115 points. This formation signals that the upward trend is most likely to continue. Therefore, if the level of 1.0739 is broken, the price will move further upwards.
- All
- All
- Bearish Rectangle
- Bearish Symmetrical Triangle
- Bearish Symmetrical Triangle
- Bullish Rectangle
- Double Top
- Double Top
- Triple Bottom
- Triple Bottom
- Triple Top
- Triple Top
- All
- All
- Buy
- Sale
- All
- 1
- 2
- 3
- 4
- 5
Teratas Ganda
was formed on 06.06 at 22:30:10 (UTC+0)
signal strength 2 of 5

Pada grafik USDCAD M15 pola reversal Teratas Ganda telah terbentuk. Karakteristik: batas atas 1.3702; batas bawah 1.3668; lebar pola 34 poin. Sinyal: tembusan ke batas bawah akan menyebabkan kelanjutan tren
Rangka waktu M5 dan M15 mungkin memiliki lebih dari titik entri yang keliru.
Open chart in a new window
Segitiga Simetris Bullish
was formed on 06.06 at 22:18:11 (UTC+0)
signal strength 2 of 5

Menurut Grafik dari M15, AUDJPY dibentuk pola Segitiga Simetris Bullish. Batas yang lebih rendah dari pola menyentuh kordinat 93.96/94.02 dimana batas atas berada sepanjang 94.07/94.02. Jika pola Segitiga Simetris Bullish
Rangka waktu M5 dan M15 mungkin memiliki lebih dari titik entri yang keliru.
Open chart in a new window
Bawah Triple
was formed on 06.06 at 22:01:08 (UTC+0)
signal strength 3 of 5

Pola Bawah Triple telah terbentuk pada grafik instrumen trading GBPAUD M30. Pola tersebut menandakan perubahan dalam trend dari menurun menjadi naik jika terjadi pemecahan (breakdown) 2.0879/2.0852
Open chart in a new window


