

اصل پیٹرن یعنی ایکچوئل پیٹرن

پیٹرن تصویری صورت یعنی گرافکل ماڈلز ہوتے ہیں جو کہ چارٹ میں قیمت کی جانب سے بنتے ہیں جو کہ ٹیکنیکل تجزیات کے امکانات ، ہسٹری {قیمت کے اتار چڑھاو} چونکہ قیمت اپنے آپ کو دہراتی ہے - جس کا مطلب یہ ہے کہ قیمت کا اتار چڑھا یعنی حرکت ایک جیسے حالات میں ہی عموما مختلف ہوتی ہے جو کہ اس بات کو ممکن بناتی ہے قیمت کے مزید رویہ کی پیشن گوئی کی جاسکے جس کا اُسی طرح ہونے کے امکانات خاصے واضح ہوتے ہیں
انسٹا فاریکس کی "ریلی وینٹ" پیٹرنز نامی سروس استعمال میں بہت ہی آسان ہے جو کہ آپ کو مارکیٹ میں ہونے والی تازہ ترین تبدیلیوں کے حوالے باخبر رکھتے ہیں اور مارکیٹ کے ملنے والے اشاروں پر بر وقت در عمل دینے کے قابل کرتے ہیں - ہماری سہولیات سے آپ ہمیشہ پائیں گے تازہ ترین اور سب سے ذیادہ کار آمد انداز یعنی ریلی وینٹ انداز دستیاب ہوں گے- جو کہ کسی بھی پئیر اور ٹائم فریم کے حوالے سے دستیاب ہوں گے
Bullish Symmetrical Triangle
was formed on 09.04 at 11:56:23 (UTC+0)
signal strength 1 of 5
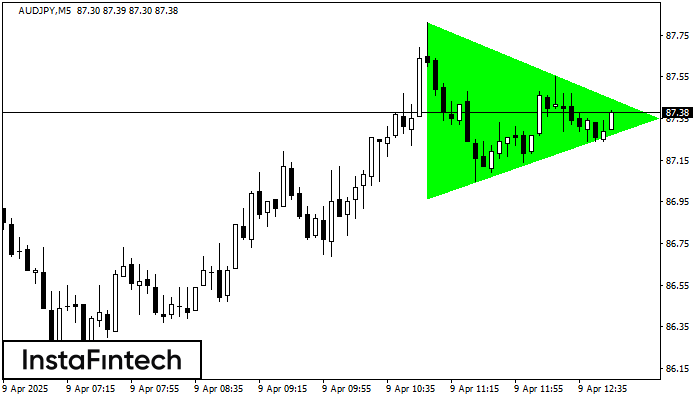
According to the chart of M5, AUDJPY formed the Bullish Symmetrical Triangle pattern, which signals the trend will continue. Description. The upper border of the pattern touches the coordinates 87.81/87.35 whereas the lower border goes across 86.97/87.35. The pattern width is measured on the chart at 84 pips. If the Bullish Symmetrical Triangle pattern is in progress during the upward trend, this indicates the current trend will go on. In case 87.35 is broken, the price could continue its move toward 87.50.
The M5 and M15 time frames may have more false entry points.
- All
- All
- Bearish Rectangle
- Bearish Symmetrical Triangle
- Bearish Symmetrical Triangle
- Bullish Rectangle
- Double Top
- Double Top
- Triple Bottom
- Triple Bottom
- Triple Top
- Triple Top
- All
- All
- Buy
- Sale
- All
- 1
- 2
- 3
- 4
- 5
Bearish Symmetrical Triangle
was formed on 22.05 at 19:51:05 (UTC+0)
signal strength 1 of 5
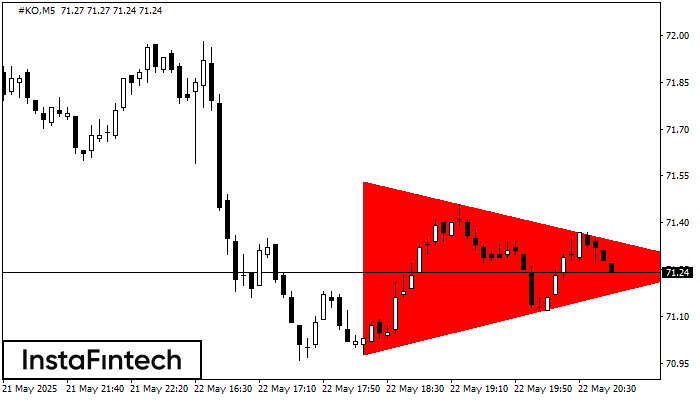
According to the chart of M5, #KO formed the Bearish Symmetrical Triangle pattern. Trading recommendations: A breach of the lower border 70.98 is likely to encourage a continuation
The M5 and M15 time frames may have more false entry points.
Open chart in a new window
Triple Bottom
was formed on 22.05 at 19:45:54 (UTC+0)
signal strength 1 of 5
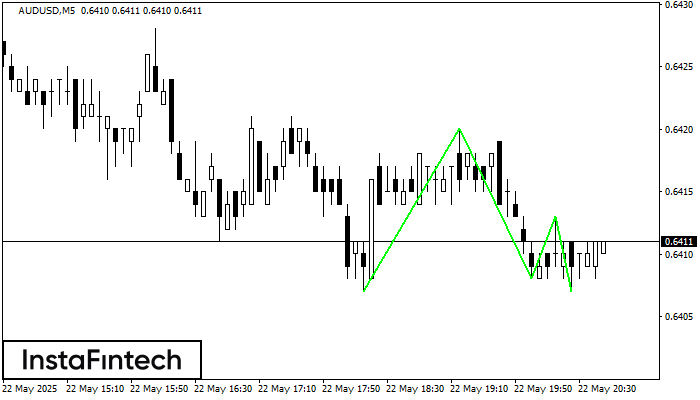
The Triple Bottom pattern has formed on the chart of AUDUSD M5. Features of the pattern: The lower line of the pattern has coordinates 0.6420 with the upper limit 0.6420/0.6413
The M5 and M15 time frames may have more false entry points.
Open chart in a new window
Double Top
was formed on 22.05 at 19:15:10 (UTC+0)
signal strength 1 of 5
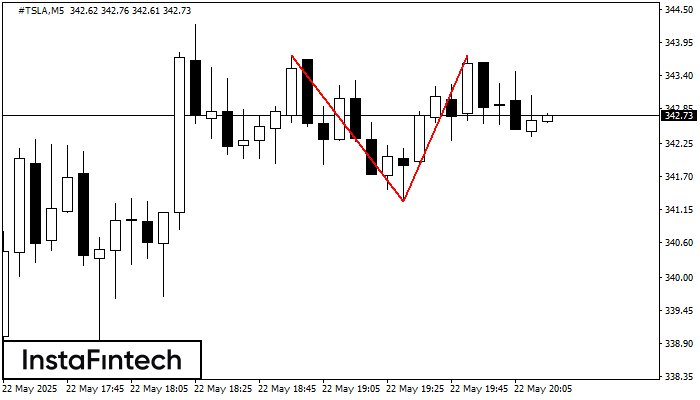
The Double Top reversal pattern has been formed on #TSLA M5. Characteristics: the upper boundary 343.73; the lower boundary 341.29; the width of the pattern is 245 points. Sell trades
The M5 and M15 time frames may have more false entry points.
Open chart in a new window


