

اصل پیٹرن یعنی ایکچوئل پیٹرن

پیٹرن تصویری صورت یعنی گرافکل ماڈلز ہوتے ہیں جو کہ چارٹ میں قیمت کی جانب سے بنتے ہیں جو کہ ٹیکنیکل تجزیات کے امکانات ، ہسٹری {قیمت کے اتار چڑھاو} چونکہ قیمت اپنے آپ کو دہراتی ہے - جس کا مطلب یہ ہے کہ قیمت کا اتار چڑھا یعنی حرکت ایک جیسے حالات میں ہی عموما مختلف ہوتی ہے جو کہ اس بات کو ممکن بناتی ہے قیمت کے مزید رویہ کی پیشن گوئی کی جاسکے جس کا اُسی طرح ہونے کے امکانات خاصے واضح ہوتے ہیں
انسٹا فاریکس کی "ریلی وینٹ" پیٹرنز نامی سروس استعمال میں بہت ہی آسان ہے جو کہ آپ کو مارکیٹ میں ہونے والی تازہ ترین تبدیلیوں کے حوالے باخبر رکھتے ہیں اور مارکیٹ کے ملنے والے اشاروں پر بر وقت در عمل دینے کے قابل کرتے ہیں - ہماری سہولیات سے آپ ہمیشہ پائیں گے تازہ ترین اور سب سے ذیادہ کار آمد انداز یعنی ریلی وینٹ انداز دستیاب ہوں گے- جو کہ کسی بھی پئیر اور ٹائم فریم کے حوالے سے دستیاب ہوں گے
Bullish Flag
was formed on 08.04 at 06:40:26 (UTC+0)
signal strength 1 of 5
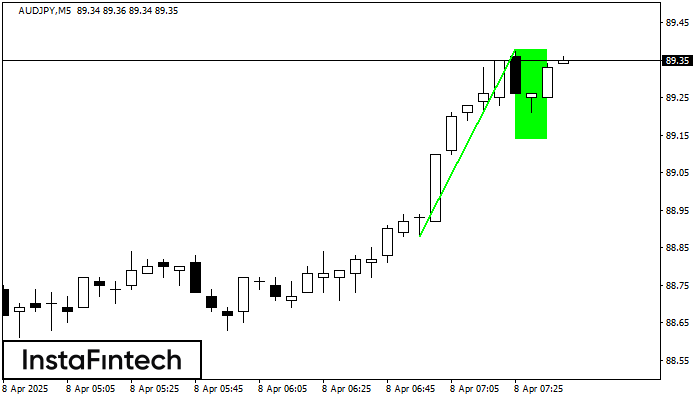
The Bullish Flag pattern has been formed on AUDJPY at M5. The lower boundary of the pattern is located at 89.14/89.14, while the higher boundary lies at 89.38/89.38. The projection of the flagpole is 50 points. This formation signals that the upward trend is most likely to continue. Therefore, if the level of 89.38 is broken, the price will move further upwards.
The M5 and M15 time frames may have more false entry points.
- All
- All
- Bearish Rectangle
- Bearish Symmetrical Triangle
- Bearish Symmetrical Triangle
- Bullish Rectangle
- Double Top
- Double Top
- Triple Bottom
- Triple Bottom
- Triple Top
- Triple Top
- All
- All
- Buy
- Sale
- All
- 1
- 2
- 3
- 4
- 5
Teratas Triple
was formed on 01.06 at 02:15:04 (UTC+0)
signal strength 2 of 5

Pada grafik instrumen trading #Bitcoin M15, pola Teratas Triple yang menandakan perubahan trend telah terbentuk. Ada kemungkinan bahwa setelah pembentukan puncak (peak) ketiga, harga akan mencoba untuk menembus level resistance
Rangka waktu M5 dan M15 mungkin memiliki lebih dari titik entri yang keliru.
Open chart in a new window
Teratas Ganda
was formed on 01.06 at 01:00:35 (UTC+0)
signal strength 3 of 5

Pola reversal Teratas Ganda telah terbentuk pada #Bitcoin M30. Karakteristik: batas atas 104800.13; batas bawah 104215.56; lebar pola 64024 poin. Transaksi jual lebih baik dibuka di bawah batas bawah 104215.56
Open chart in a new window
Persegi Bullish
was formed on 31.05 at 19:15:46 (UTC+0)
signal strength 1 of 5

Menurut grafik dari M5, #Bitcoin terbentuk Persegi Bullish yang merupakan pola dari kelanjutan tren. Pola terkandung dalam batas berikut: batas yang lebih rendah 104335.43 – 104335.43 dan batas atas 104800.13
Rangka waktu M5 dan M15 mungkin memiliki lebih dari titik entri yang keliru.
Open chart in a new window


