

اصل پیٹرن یعنی ایکچوئل پیٹرن

پیٹرن تصویری صورت یعنی گرافکل ماڈلز ہوتے ہیں جو کہ چارٹ میں قیمت کی جانب سے بنتے ہیں جو کہ ٹیکنیکل تجزیات کے امکانات ، ہسٹری {قیمت کے اتار چڑھاو} چونکہ قیمت اپنے آپ کو دہراتی ہے - جس کا مطلب یہ ہے کہ قیمت کا اتار چڑھا یعنی حرکت ایک جیسے حالات میں ہی عموما مختلف ہوتی ہے جو کہ اس بات کو ممکن بناتی ہے قیمت کے مزید رویہ کی پیشن گوئی کی جاسکے جس کا اُسی طرح ہونے کے امکانات خاصے واضح ہوتے ہیں
انسٹا فاریکس کی "ریلی وینٹ" پیٹرنز نامی سروس استعمال میں بہت ہی آسان ہے جو کہ آپ کو مارکیٹ میں ہونے والی تازہ ترین تبدیلیوں کے حوالے باخبر رکھتے ہیں اور مارکیٹ کے ملنے والے اشاروں پر بر وقت در عمل دینے کے قابل کرتے ہیں - ہماری سہولیات سے آپ ہمیشہ پائیں گے تازہ ترین اور سب سے ذیادہ کار آمد انداز یعنی ریلی وینٹ انداز دستیاب ہوں گے- جو کہ کسی بھی پئیر اور ٹائم فریم کے حوالے سے دستیاب ہوں گے
Double Top
was formed on 03.04 at 16:00:01 (UTC+0)
signal strength 2 of 5
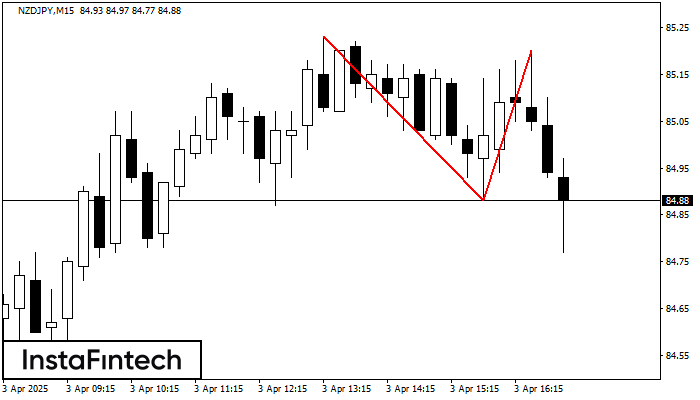
The Double Top pattern has been formed on NZDJPY M15. It signals that the trend has been changed from upwards to downwards. Probably, if the base of the pattern 84.88 is broken, the downward movement will continue.
The M5 and M15 time frames may have more false entry points.
- All
- All
- Bearish Rectangle
- Bearish Symmetrical Triangle
- Bearish Symmetrical Triangle
- Bullish Rectangle
- Double Top
- Double Top
- Triple Bottom
- Triple Bottom
- Triple Top
- Triple Top
- All
- All
- Buy
- Sale
- All
- 1
- 2
- 3
- 4
- 5
Triple Top
was formed on 30.05 at 22:20:23 (UTC+0)
signal strength 1 of 5

Corak Triple Top telah dibentuk pada carta bagi instrumen dagangan GOLD M5. Ia adalah corak pembalikan yang memaparkan ciri-ciri berikut: tahap rintangan 4, tahap sokongan -193, dan lebar corak
Carta masa M5 dan M15 mungkin mempunyai lebih banyak titik kemasukan palsu.
Open chart in a new window
Inverse Head dan Shoulder
was formed on 30.05 at 21:50:24 (UTC+0)
signal strength 1 of 5

Berdasarkan carta M5, #AMZN menghasilkan corak yang dinyatakan Inverse Head dan Shoulder. Head telah ditetapkan pada 201.64 manakala garisan median Neck ditetapkan pada 204.52/205.01. Pembentukan Corak Inverse Head dan Shoulder
Carta masa M5 dan M15 mungkin mempunyai lebih banyak titik kemasukan palsu.
Open chart in a new window
Segi Empat Menurun
was formed on 30.05 at 21:36:36 (UTC+0)
signal strength 1 of 5

Berdasarkan carta M5, GBPAUD telah membentuk Segi Empat Menurun yang merupakan corak kesinambungan aliran. Corak terkandung dalam sempadan berikut: sempadan bawah 2.0897 – 2.0897 dan sempadan atas 2.0908 – 2.0908
Carta masa M5 dan M15 mungkin mempunyai lebih banyak titik kemasukan palsu.
Open chart in a new window


