

اصل پیٹرن یعنی ایکچوئل پیٹرن

پیٹرن تصویری صورت یعنی گرافکل ماڈلز ہوتے ہیں جو کہ چارٹ میں قیمت کی جانب سے بنتے ہیں جو کہ ٹیکنیکل تجزیات کے امکانات ، ہسٹری {قیمت کے اتار چڑھاو} چونکہ قیمت اپنے آپ کو دہراتی ہے - جس کا مطلب یہ ہے کہ قیمت کا اتار چڑھا یعنی حرکت ایک جیسے حالات میں ہی عموما مختلف ہوتی ہے جو کہ اس بات کو ممکن بناتی ہے قیمت کے مزید رویہ کی پیشن گوئی کی جاسکے جس کا اُسی طرح ہونے کے امکانات خاصے واضح ہوتے ہیں
انسٹا فاریکس کی "ریلی وینٹ" پیٹرنز نامی سروس استعمال میں بہت ہی آسان ہے جو کہ آپ کو مارکیٹ میں ہونے والی تازہ ترین تبدیلیوں کے حوالے باخبر رکھتے ہیں اور مارکیٹ کے ملنے والے اشاروں پر بر وقت در عمل دینے کے قابل کرتے ہیں - ہماری سہولیات سے آپ ہمیشہ پائیں گے تازہ ترین اور سب سے ذیادہ کار آمد انداز یعنی ریلی وینٹ انداز دستیاب ہوں گے- جو کہ کسی بھی پئیر اور ٹائم فریم کے حوالے سے دستیاب ہوں گے
Bearish pennant
was formed on 03.04 at 14:46:03 (UTC+0)
signal strength 1 of 5
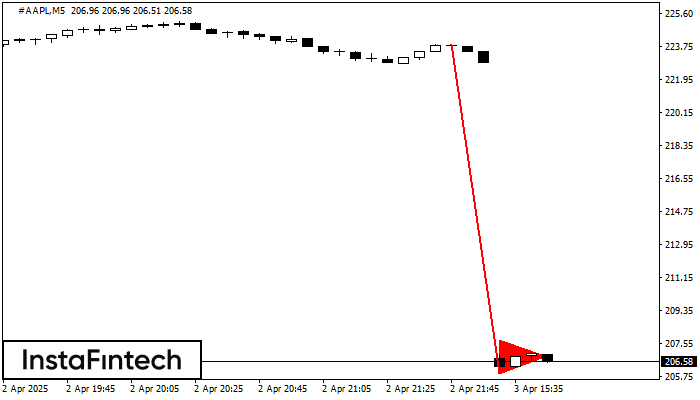
The Bearish pennant pattern has formed on the #AAPL M5 chart. It signals potential continuation of the existing trend. Specifications: the pattern’s bottom has the coordinate of 205.88; the projection of the flagpole height is equal to 1802 pips. In case the price breaks out the pattern’s bottom of 205.88, the downtrend is expected to continue for further level 205.74.
The M5 and M15 time frames may have more false entry points.
یہ بھی دیکھیں
- All
- All
- Bearish Rectangle
- Bearish Symmetrical Triangle
- Bearish Symmetrical Triangle
- Bullish Rectangle
- Double Top
- Double Top
- Triple Bottom
- Triple Bottom
- Triple Top
- Triple Top
- All
- All
- Buy
- Sale
- All
- 1
- 2
- 3
- 4
- 5
Double Top
was formed on 14.04 at 02:30:27 (UTC+0)
signal strength 2 of 5
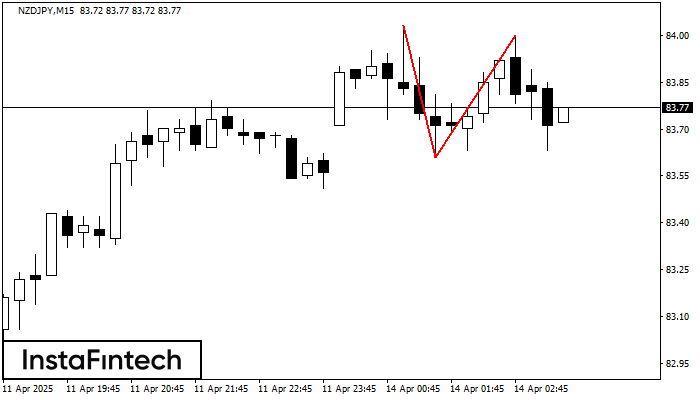
The Double Top reversal pattern has been formed on NZDJPY M15. Characteristics: the upper boundary 84.03; the lower boundary 83.61; the width of the pattern is 39 points. Sell trades
The M5 and M15 time frames may have more false entry points.
Open chart in a new window
Double Top
was formed on 14.04 at 02:00:14 (UTC+0)
signal strength 1 of 5
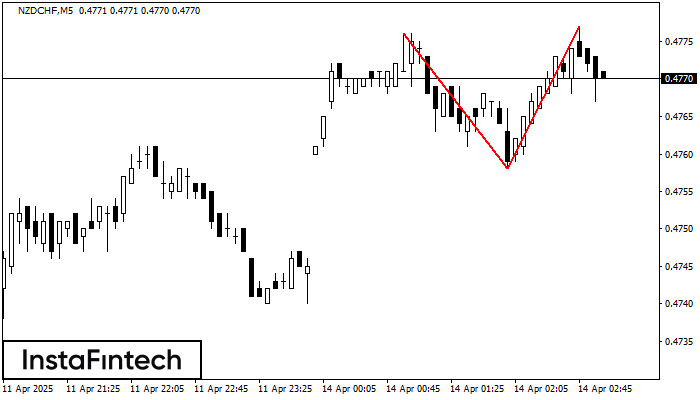
The Double Top reversal pattern has been formed on NZDCHF M5. Characteristics: the upper boundary 0.4776; the lower boundary 0.4758; the width of the pattern is 19 points. Sell trades
The M5 and M15 time frames may have more false entry points.
Open chart in a new window
Bullish pennant
was formed on 14.04 at 01:45:23 (UTC+0)
signal strength 2 of 5
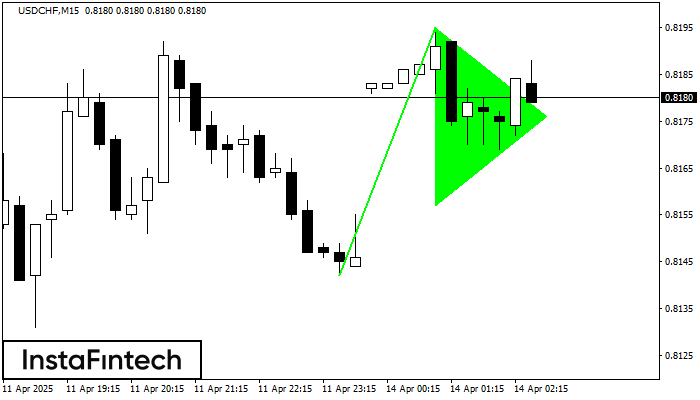
The Bullish pennant signal – Trading instrument USDCHF M15, continuation pattern. Forecast: it is possible to set up a buy position above the pattern’s high of 0.8195, with the prospect
The M5 and M15 time frames may have more false entry points.
Open chart in a new window


