

اصل پیٹرن یعنی ایکچوئل پیٹرن

پیٹرن تصویری صورت یعنی گرافکل ماڈلز ہوتے ہیں جو کہ چارٹ میں قیمت کی جانب سے بنتے ہیں جو کہ ٹیکنیکل تجزیات کے امکانات ، ہسٹری {قیمت کے اتار چڑھاو} چونکہ قیمت اپنے آپ کو دہراتی ہے - جس کا مطلب یہ ہے کہ قیمت کا اتار چڑھا یعنی حرکت ایک جیسے حالات میں ہی عموما مختلف ہوتی ہے جو کہ اس بات کو ممکن بناتی ہے قیمت کے مزید رویہ کی پیشن گوئی کی جاسکے جس کا اُسی طرح ہونے کے امکانات خاصے واضح ہوتے ہیں
انسٹا فاریکس کی "ریلی وینٹ" پیٹرنز نامی سروس استعمال میں بہت ہی آسان ہے جو کہ آپ کو مارکیٹ میں ہونے والی تازہ ترین تبدیلیوں کے حوالے باخبر رکھتے ہیں اور مارکیٹ کے ملنے والے اشاروں پر بر وقت در عمل دینے کے قابل کرتے ہیں - ہماری سہولیات سے آپ ہمیشہ پائیں گے تازہ ترین اور سب سے ذیادہ کار آمد انداز یعنی ریلی وینٹ انداز دستیاب ہوں گے- جو کہ کسی بھی پئیر اور ٹائم فریم کے حوالے سے دستیاب ہوں گے
Double Top
was formed on 31.03 at 13:22:23 (UTC+0)
signal strength 1 of 5
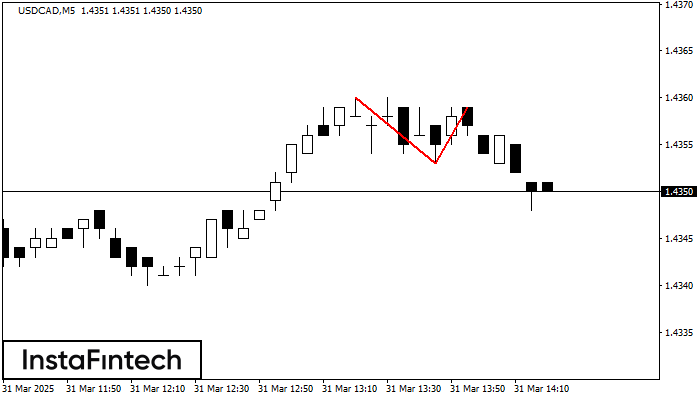
On the chart of USDCAD M5 the Double Top reversal pattern has been formed. Characteristics: the upper boundary 1.4359; the lower boundary 1.4353; the width of the pattern 6 points. The signal: a break of the lower boundary will cause continuation of the downward trend targeting the 1.4338 level.
The M5 and M15 time frames may have more false entry points.
- All
- All
- Bearish Rectangle
- Bearish Symmetrical Triangle
- Bearish Symmetrical Triangle
- Bullish Rectangle
- Double Top
- Double Top
- Triple Bottom
- Triple Bottom
- Triple Top
- Triple Top
- All
- All
- Buy
- Sale
- All
- 1
- 2
- 3
- 4
- 5
Pennant Aliran Menurun
was formed on 28.05 at 08:12:58 (UTC+0)
signal strength 1 of 5

Corak Pennant Aliran Menurun telah dibentuk pada carta GBPJPY M5. Ia menandakan potensi kesinambungan aliran yang sedia ada. Spesifikasi: bahagian corak mempunyai koordinat 194.35; unjuran ketinggian flagpole adalah sama dengan
Carta masa M5 dan M15 mungkin mempunyai lebih banyak titik kemasukan palsu.
Open chart in a new window
Segi Tiga Simetri Menaik
was formed on 28.05 at 07:55:36 (UTC+0)
signal strength 1 of 5

Berdasarkan carta M5, GBPAUD membentuk corak Segi Tiga Simetri Menaik yang menandakan aliran akan berterusan. Penerangan. Sempadan atas corak menyentuh koordinat 2.0988/2.0939 sedangkan sempadan bawah merentasi 2.0903/2.0939. Lebar corak diukur
Carta masa M5 dan M15 mungkin mempunyai lebih banyak titik kemasukan palsu.
Open chart in a new window
Segi Tiga Simetri Menurun
was formed on 28.05 at 07:55:12 (UTC+0)
signal strength 1 of 5

Berdasarkan carta M5, NZDJPY membentuk corak Segi Tiga Simetri Menurun. Penerangan: Sempadan yang lebih rendah ialah 85.44/85.92 dan sempadan atas adalah 86.64/85.92. Lebar corak diukur pada carta pada -120 pips
Carta masa M5 dan M15 mungkin mempunyai lebih banyak titik kemasukan palsu.
Open chart in a new window


