

اصل پیٹرن یعنی ایکچوئل پیٹرن

پیٹرن تصویری صورت یعنی گرافکل ماڈلز ہوتے ہیں جو کہ چارٹ میں قیمت کی جانب سے بنتے ہیں جو کہ ٹیکنیکل تجزیات کے امکانات ، ہسٹری {قیمت کے اتار چڑھاو} چونکہ قیمت اپنے آپ کو دہراتی ہے - جس کا مطلب یہ ہے کہ قیمت کا اتار چڑھا یعنی حرکت ایک جیسے حالات میں ہی عموما مختلف ہوتی ہے جو کہ اس بات کو ممکن بناتی ہے قیمت کے مزید رویہ کی پیشن گوئی کی جاسکے جس کا اُسی طرح ہونے کے امکانات خاصے واضح ہوتے ہیں
انسٹا فاریکس کی "ریلی وینٹ" پیٹرنز نامی سروس استعمال میں بہت ہی آسان ہے جو کہ آپ کو مارکیٹ میں ہونے والی تازہ ترین تبدیلیوں کے حوالے باخبر رکھتے ہیں اور مارکیٹ کے ملنے والے اشاروں پر بر وقت در عمل دینے کے قابل کرتے ہیں - ہماری سہولیات سے آپ ہمیشہ پائیں گے تازہ ترین اور سب سے ذیادہ کار آمد انداز یعنی ریلی وینٹ انداز دستیاب ہوں گے- جو کہ کسی بھی پئیر اور ٹائم فریم کے حوالے سے دستیاب ہوں گے
Bearish pennant
was formed on 31.03 at 01:15:38 (UTC+0)
signal strength 2 of 5

The Bearish pennant pattern has formed on the AUDUSD M15 chart. It signals potential continuation of the existing trend. Specifications: the pattern’s bottom has the coordinate of 0.6272; the projection of the flagpole height is equal to 19 pips. In case the price breaks out the pattern’s bottom of 0.6272, the downtrend is expected to continue for further level 0.6249.
The M5 and M15 time frames may have more false entry points.
- All
- All
- Bearish Rectangle
- Bearish Symmetrical Triangle
- Bearish Symmetrical Triangle
- Bullish Rectangle
- Double Top
- Double Top
- Triple Bottom
- Triple Bottom
- Triple Top
- Triple Top
- All
- All
- Buy
- Sale
- All
- 1
- 2
- 3
- 4
- 5
Segitiga Simetris Bullish
was formed on 02.06 at 09:22:12 (UTC+0)
signal strength 4 of 5

Menurut Grafik dari H1, EURJPY dibentuk pola Segitiga Simetris Bullish. Batas yang lebih rendah dari pola menyentuh kordinat 162.28/163.37 dimana batas atas berada sepanjang 164.23/163.37. Jika pola Segitiga Simetris Bullish
Open chart in a new window
Bawah Ganda
was formed on 02.06 at 09:00:13 (UTC+0)
signal strength 3 of 5

Pola Bawah Ganda telah terbentuk pada GBPJPY M30. Karakteristik: level support 193.37; level resistance 194.63; lebar pola 126 poin. Jika level resistance ditembus, perubahan dalam tren dapat diprediksi dengan target
Open chart in a new window
Bawah Ganda
was formed on 02.06 at 09:00:05 (UTC+0)
signal strength 4 of 5
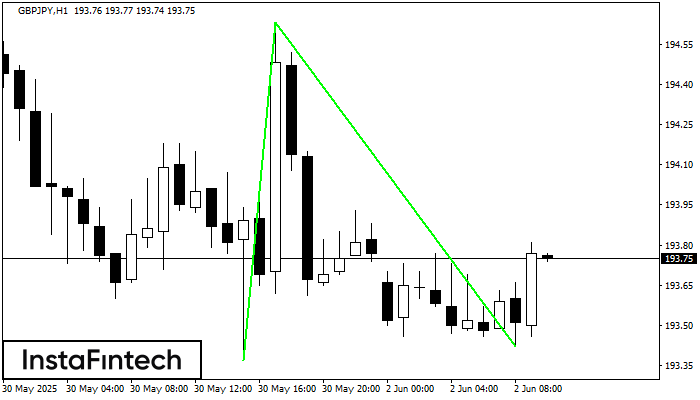
Pola Bawah Ganda telah terbentuk pada GBPJPY H1. Formasi ini mensinyalkan reversal tren dari arah penurunan ke arah kenaikan. Sinyal menunjukkan bahwa transaksi beli harus dibuka setelah batas atas pola
Open chart in a new window


