

اصل پیٹرن یعنی ایکچوئل پیٹرن

پیٹرن تصویری صورت یعنی گرافکل ماڈلز ہوتے ہیں جو کہ چارٹ میں قیمت کی جانب سے بنتے ہیں جو کہ ٹیکنیکل تجزیات کے امکانات ، ہسٹری {قیمت کے اتار چڑھاو} چونکہ قیمت اپنے آپ کو دہراتی ہے - جس کا مطلب یہ ہے کہ قیمت کا اتار چڑھا یعنی حرکت ایک جیسے حالات میں ہی عموما مختلف ہوتی ہے جو کہ اس بات کو ممکن بناتی ہے قیمت کے مزید رویہ کی پیشن گوئی کی جاسکے جس کا اُسی طرح ہونے کے امکانات خاصے واضح ہوتے ہیں
انسٹا فاریکس کی "ریلی وینٹ" پیٹرنز نامی سروس استعمال میں بہت ہی آسان ہے جو کہ آپ کو مارکیٹ میں ہونے والی تازہ ترین تبدیلیوں کے حوالے باخبر رکھتے ہیں اور مارکیٹ کے ملنے والے اشاروں پر بر وقت در عمل دینے کے قابل کرتے ہیں - ہماری سہولیات سے آپ ہمیشہ پائیں گے تازہ ترین اور سب سے ذیادہ کار آمد انداز یعنی ریلی وینٹ انداز دستیاب ہوں گے- جو کہ کسی بھی پئیر اور ٹائم فریم کے حوالے سے دستیاب ہوں گے
Bullish Flag
was formed on 05.03 at 13:00:39 (UTC+0)
signal strength 3 of 5
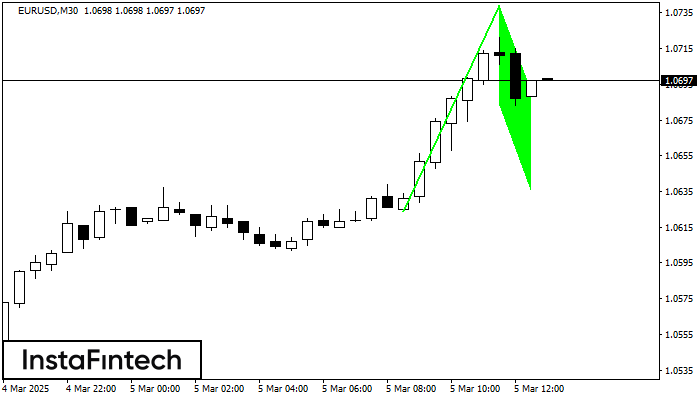
The Bullish Flag pattern has been formed on EURUSD at M30. The lower boundary of the pattern is located at 1.0683/1.0635, while the higher boundary lies at 1.0739/1.0691. The projection of the flagpole is 115 points. This formation signals that the upward trend is most likely to continue. Therefore, if the level of 1.0739 is broken, the price will move further upwards.
- All
- All
- Bearish Rectangle
- Bearish Symmetrical Triangle
- Bearish Symmetrical Triangle
- Bullish Rectangle
- Double Top
- Double Top
- Triple Bottom
- Triple Bottom
- Triple Top
- Triple Top
- All
- All
- Buy
- Sale
- All
- 1
- 2
- 3
- 4
- 5
Double Top
was formed on 26.05 at 05:05:43 (UTC+0)
signal strength 1 of 5
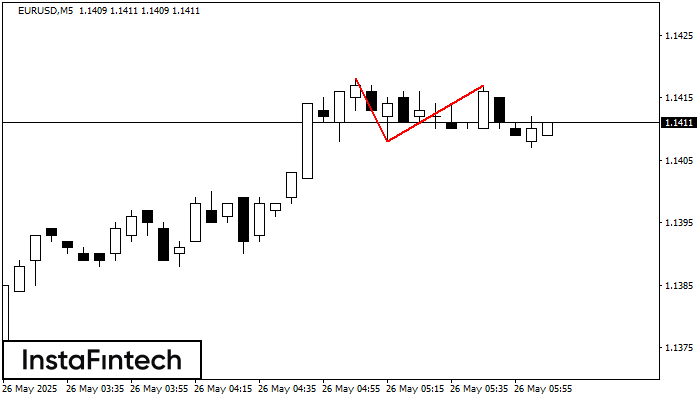
On the chart of EURUSD M5 the Double Top reversal pattern has been formed. Characteristics: the upper boundary 1.1417; the lower boundary 1.1408; the width of the pattern 9 points
The M5 and M15 time frames may have more false entry points.
Open chart in a new window
Double Top
was formed on 26.05 at 05:05:40 (UTC+0)
signal strength 1 of 5
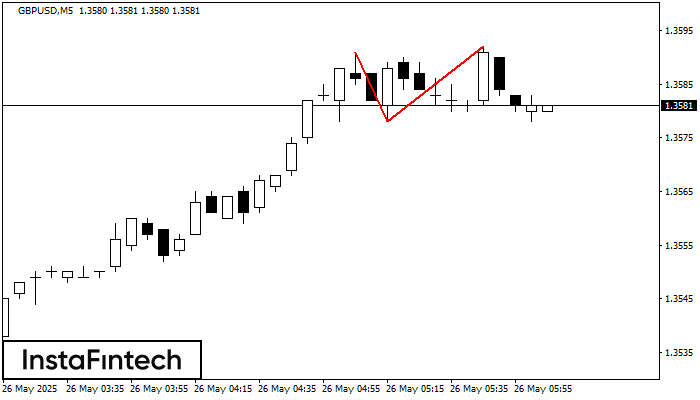
On the chart of GBPUSD M5 the Double Top reversal pattern has been formed. Characteristics: the upper boundary 1.3592; the lower boundary 1.3578; the width of the pattern 14 points
The M5 and M15 time frames may have more false entry points.
Open chart in a new window
Double Top
was formed on 26.05 at 04:15:25 (UTC+0)
signal strength 2 of 5
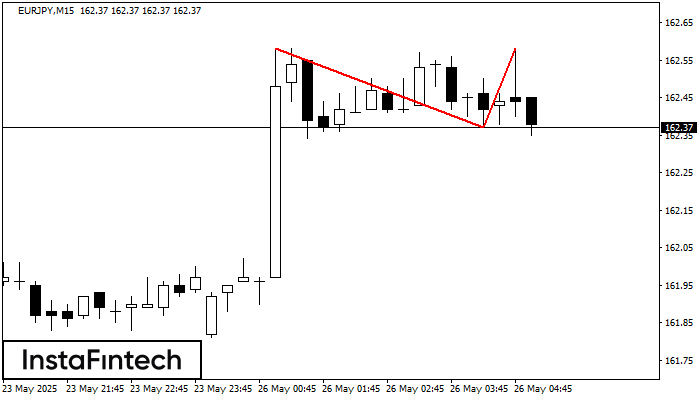
On the chart of EURJPY M15 the Double Top reversal pattern has been formed. Characteristics: the upper boundary 162.58; the lower boundary 162.37; the width of the pattern 21 points
The M5 and M15 time frames may have more false entry points.
Open chart in a new window


