

Actual patterns

Patterns are graphical models which are formed in the chart by the price. According to one of the technical analysis postulates, history (price movement) repeats itself. It means that the price movements are often similar in the same situations which makes it possible to predict the further development of the situation with a high probability.
Relevant patterns by InstaTrade is an easy-to-use service which allows you to be aware of latest changes in the market and react to clues from the market in time. In our service you will always find the latest and most relevant patterns on any pair and any timeframe.
Double Top
was formed on 29.04 at 10:45:00 (UTC+0)
signal strength 1 of 5
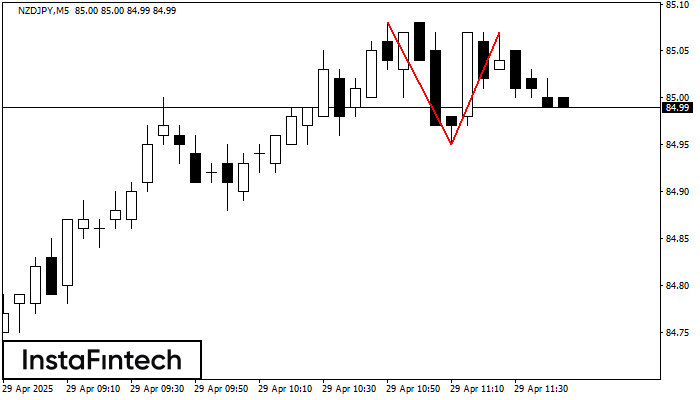
On the chart of NZDJPY M5 the Double Top reversal pattern has been formed. Characteristics: the upper boundary 85.07; the lower boundary 84.95; the width of the pattern 12 points. The signal: a break of the lower boundary will cause continuation of the downward trend targeting the 84.80 level.
The M5 and M15 time frames may have more false entry points.
- All
- All
- Bearish Rectangle
- Bearish Symmetrical Triangle
- Bearish Symmetrical Triangle
- Bullish Rectangle
- Double Top
- Double Top
- Triple Bottom
- Triple Bottom
- Triple Top
- Triple Top
- All
- All
- Buy
- Sale
- All
- 1
- 2
- 3
- 4
- 5
Двойное дно
сформирован 23.05 в 09:29:51 (UTC+0)
сила сигнала 2 из 5
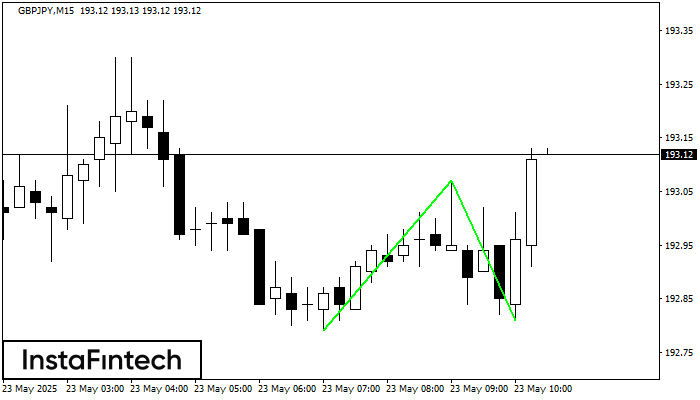
Сформирована фигура «Двойное дно» на графике GBPJPY M15. Характеристика: Уровень поддержки 192.79; Уровень сопротивления 193.07; Ширина фигуры 28 пунктов. В случае пробоя уровня сопротивления можно будет прогнозировать изменение тенденции
Таймфреймы М5 и М15 могут иметь больше ложных точек входа.
Открыть график инструмента в новом окне
Бычий симметричный треугольник
сформирован 23.05 в 09:10:52 (UTC+0)
сила сигнала 2 из 5
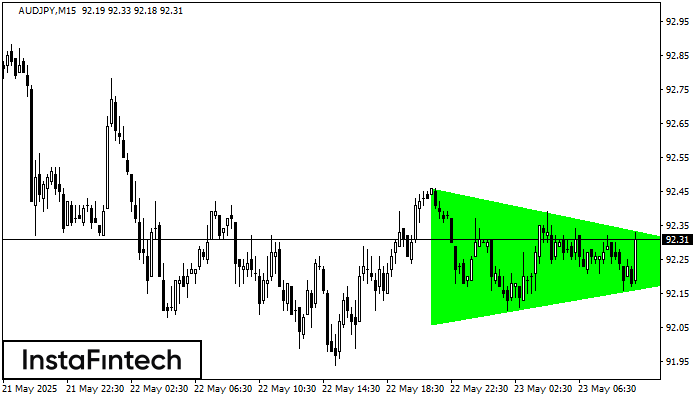
По AUDJPY на M15 сформировалась фигура «Бычий симметричный треугольник», которая сигнализирует нам о продолжении тенденции. Характеристика: Верхняя граница фигуры имеет координаты 92.46/92.24; Нижняя граница 92.06/92.24; Проекция ширины фигуры 40 пунктов
Таймфреймы М5 и М15 могут иметь больше ложных точек входа.
Открыть график инструмента в новом окне
Бычий симметричный треугольник
сформирован 23.05 в 08:47:46 (UTC+0)
сила сигнала 1 из 5
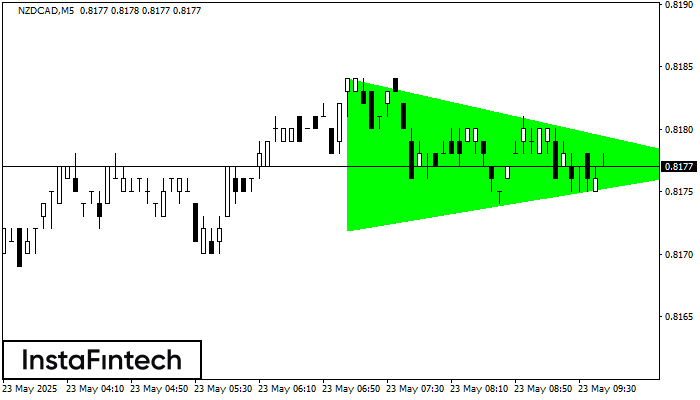
По NZDCAD на M5 сформировалась фигура «Бычий симметричный треугольник», которая сигнализирует нам о продолжении тенденции. Характеристика: Верхняя граница фигуры имеет координаты 0.8184/0.8177; Нижняя граница 0.8172/0.8177; Проекция ширины фигуры 12 пунктов
Таймфреймы М5 и М15 могут иметь больше ложных точек входа.
Открыть график инструмента в новом окне


