

Actual patterns

Patterns are graphical models which are formed in the chart by the price. According to one of the technical analysis postulates, history (price movement) repeats itself. It means that the price movements are often similar in the same situations which makes it possible to predict the further development of the situation with a high probability.
Relevant patterns by InstaTrade is an easy-to-use service which allows you to be aware of latest changes in the market and react to clues from the market in time. In our service you will always find the latest and most relevant patterns on any pair and any timeframe.
Bullish Rectangle
was formed on 28.04 at 01:22:28 (UTC+0)
signal strength 3 of 5
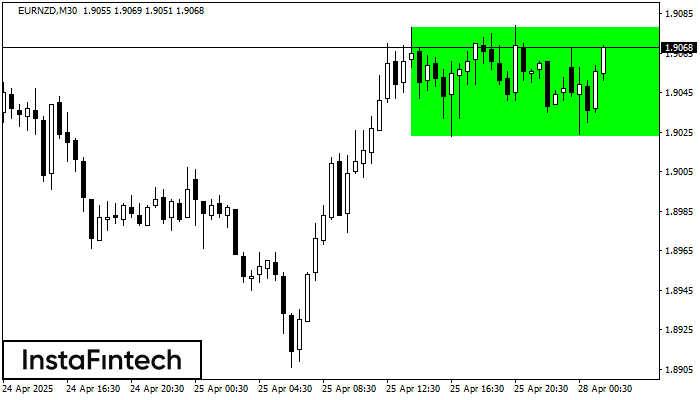
According to the chart of M30, EURNZD formed the Bullish Rectangle which is a pattern of a trend continuation. The pattern is contained within the following borders: the lower border 1.9023 – 1.9023 and upper border 1.9078 – 1.9078. In case the upper border is broken, the instrument is likely to follow the upward trend.
- All
- All
- Bearish Rectangle
- Bearish Symmetrical Triangle
- Bearish Symmetrical Triangle
- Bullish Rectangle
- Double Top
- Double Top
- Triple Bottom
- Triple Bottom
- Triple Top
- Triple Top
- All
- All
- Buy
- Sale
- All
- 1
- 2
- 3
- 4
- 5
Triángulo Simétrico Bajista
was formed on 21.05 at 11:46:23 (UTC+0)
signal strength 3 of 5
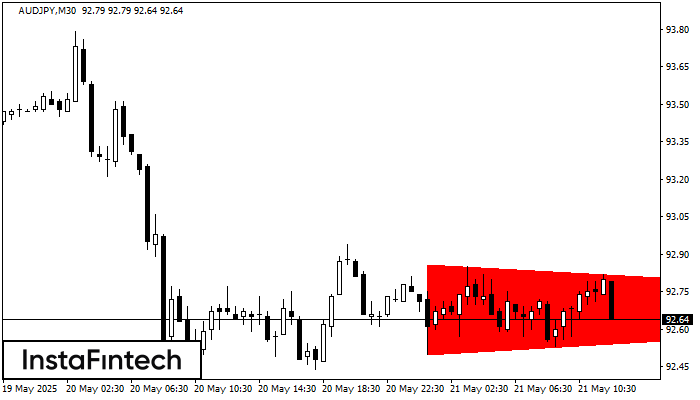
Según el gráfico de M30, el AUDJPY formó el patrón Triángulo Simétrico Bajista. Este patrón señala una tendencia bajista en caso de que el límite inferior 92.50 sea roto. Aquí
Open chart in a new window
Doble Techo
was formed on 21.05 at 11:35:20 (UTC+0)
signal strength 1 of 5
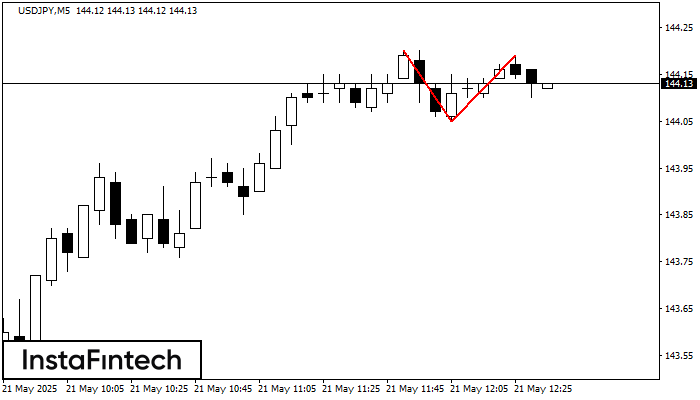
En el gráfico de USDJPY M5 el patrón de reversión Doble Techo ha sido formado. Características: límite superior 144.19; límite inferior 144.05; el ancho del patrón 14 puntos. La señal
Los marcos de tiempo M5 y M15 pueden tener más puntos de entrada falsos.
Open chart in a new window
Rectángulo Alcista
was formed on 21.05 at 11:35:00 (UTC+0)
signal strength 1 of 5
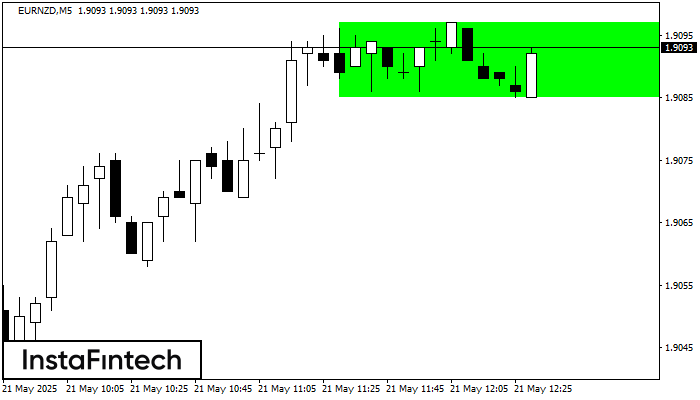
Según el gráfico de M5, EURNZD formó el Rectángulo Alcista que es un patrón de la continuación de una tendencia. El patrón está contenido dentro de los siguientes límites
Los marcos de tiempo M5 y M15 pueden tener más puntos de entrada falsos.
Open chart in a new window


