Actual patterns

Patterns are graphical models which are formed in the chart by the price. According to one of the technical analysis postulates, history (price movement) repeats itself. It means that the price movements are often similar in the same situations which makes it possible to predict the further development of the situation with a high probability.
Relevant patterns by InstaTrade is an easy-to-use service which allows you to be aware of latest changes in the market and react to clues from the market in time. In our service you will always find the latest and most relevant patterns on any pair and any timeframe.
Bullish Rectangle
was formed on 23.04 at 16:30:47 (UTC+0)
signal strength 1 of 5
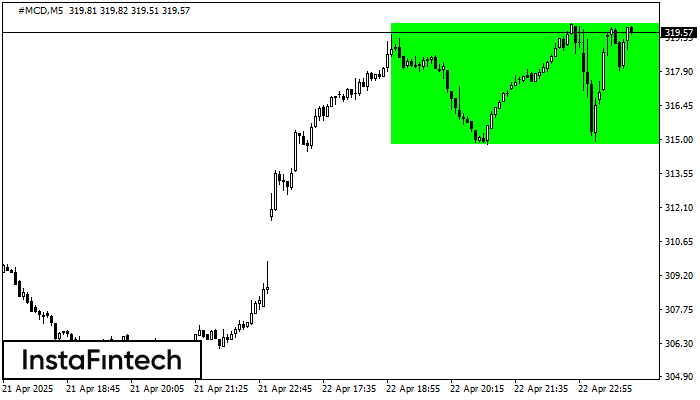
According to the chart of M5, #MCD formed the Bullish Rectangle. The pattern indicates a trend continuation. The upper border is 319.97, the lower border is 314.80. The signal means that a long position should be opened above the upper border 319.97 of the Bullish Rectangle.
The M5 and M15 time frames may have more false entry points.
- All
- All
- Bearish Rectangle
- Bearish Symmetrical Triangle
- Bearish Symmetrical Triangle
- Bullish Rectangle
- Double Top
- Double Top
- Triple Bottom
- Triple Bottom
- Triple Top
- Triple Top
- All
- All
- Buy
- Sale
- All
- 1
- 2
- 3
- 4
- 5
Triple Piso
was formed on 21.05 at 10:00:16 (UTC+0)
signal strength 4 of 5
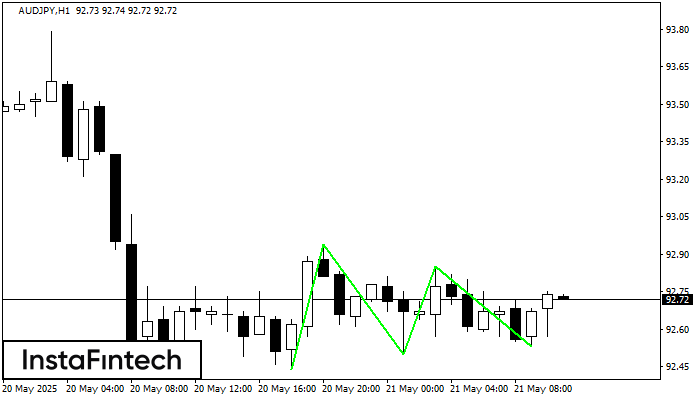
El patrón Triple Piso ha sido formado en AUDJPY H1. Este tiene las siguientes características: nivel de resistencia 92.94/92.85; nivel de soporte 92.44/92.53; el ancho es 50 puntos. En caso
Open chart in a new window
Doble Piso
was formed on 21.05 at 10:00:05 (UTC+0)
signal strength 3 of 5
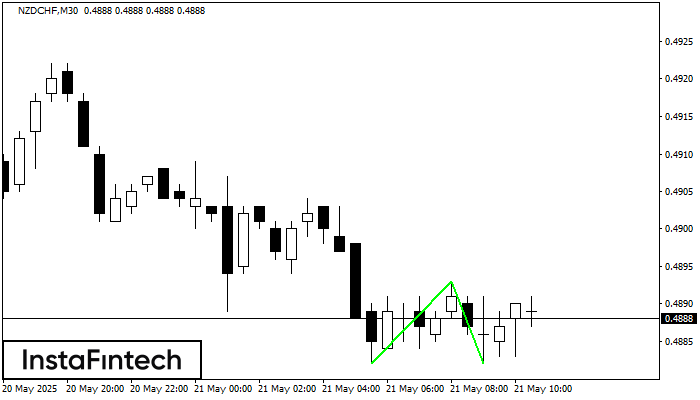
El patrón Doble Piso ha sido formado en NZDCHF M30. Características: el nivel de soporte 0.4882; el nivel de resistencia 0.4893; el ancho del patrón 11 puntos. Si el nivel
Open chart in a new window
Doble Piso
was formed on 21.05 at 09:30:46 (UTC+0)
signal strength 2 of 5
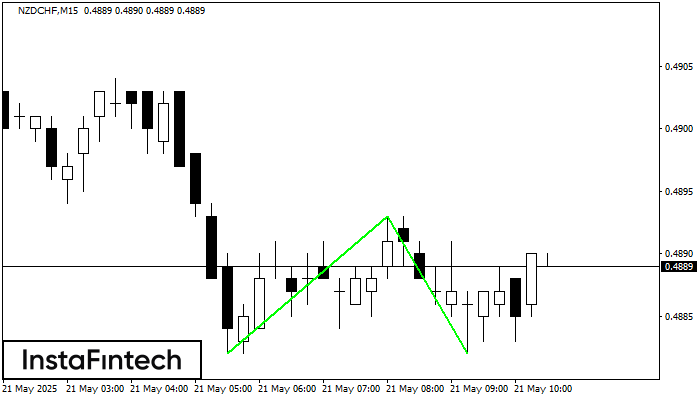
El patrón Doble Piso ha sido formado en NZDCHF M15. Características: el nivel de soporte 0.4882; el nivel de resistencia 0.4893; el ancho del patrón 11 puntos. Si el nivel
Los marcos de tiempo M5 y M15 pueden tener más puntos de entrada falsos.
Open chart in a new window