

Actual patterns

Patterns are graphical models which are formed in the chart by the price. According to one of the technical analysis postulates, history (price movement) repeats itself. It means that the price movements are often similar in the same situations which makes it possible to predict the further development of the situation with a high probability.
Relevant patterns by InstaTrade is an easy-to-use service which allows you to be aware of latest changes in the market and react to clues from the market in time. In our service you will always find the latest and most relevant patterns on any pair and any timeframe.
Bullish Symmetrical Triangle
was formed on 23.04 at 14:40:53 (UTC+0)
signal strength 1 of 5
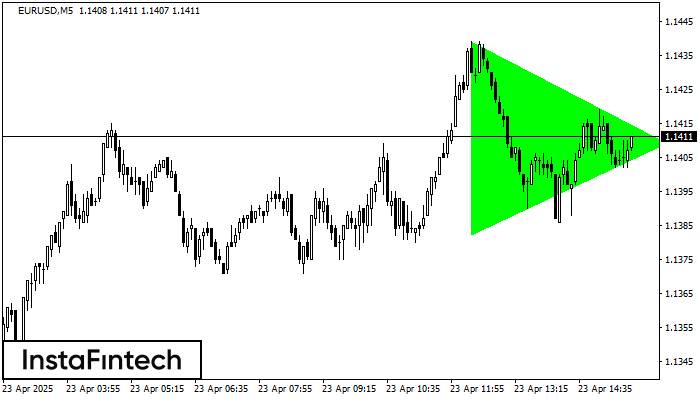
According to the chart of M5, EURUSD formed the Bullish Symmetrical Triangle pattern. The lower border of the pattern touches the coordinates 1.1382/1.1409 whereas the upper border goes across 1.1439/1.1409. If the Bullish Symmetrical Triangle pattern is in progress, this evidently signals a further upward trend. In other words, in case the scenario comes true, the price of EURUSD will breach the upper border to head for 1.1424.
The M5 and M15 time frames may have more false entry points.
- All
- All
- Bearish Rectangle
- Bearish Symmetrical Triangle
- Bearish Symmetrical Triangle
- Bullish Rectangle
- Double Top
- Double Top
- Triple Bottom
- Triple Bottom
- Triple Top
- Triple Top
- All
- All
- Buy
- Sale
- All
- 1
- 2
- 3
- 4
- 5
Triángulo Simétrico Bajista
was formed on 21.05 at 04:39:41 (UTC+0)
signal strength 3 of 5
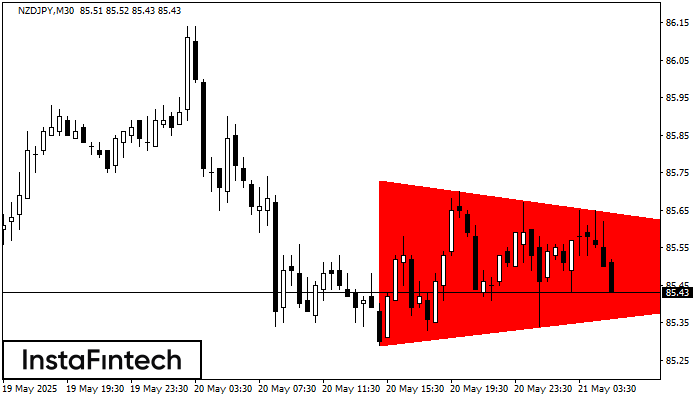
Según el gráfico de M30, el NZDJPY formó el patrón Triángulo Simétrico Bajista. Descripción: El límite inferior es 85.29/85.49 y el límite superior es 85.73/85.49. El ancho del patrón
Open chart in a new window
Rectángulo Bajista
was formed on 21.05 at 04:39:35 (UTC+0)
signal strength 3 of 5
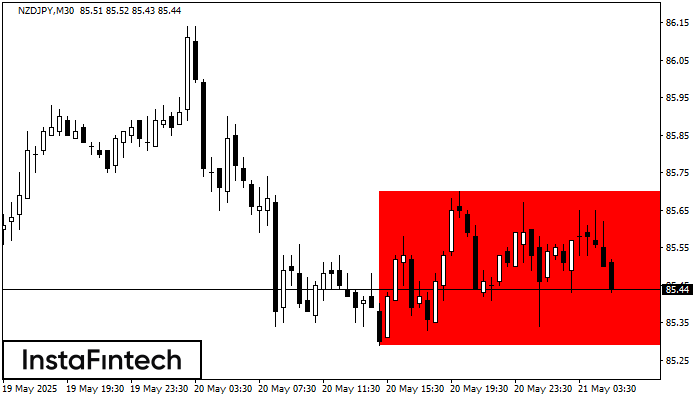
Según el gráfico de M30, NZDJPY formó el Rectángulo Bajista. Este tipo de patrón indica la continuación de una tendencia. Esto consiste de dos niveles: resistencia 85.70 - 0.00
Open chart in a new window
Rectángulo Alcista
was formed on 21.05 at 04:25:18 (UTC+0)
signal strength 3 of 5
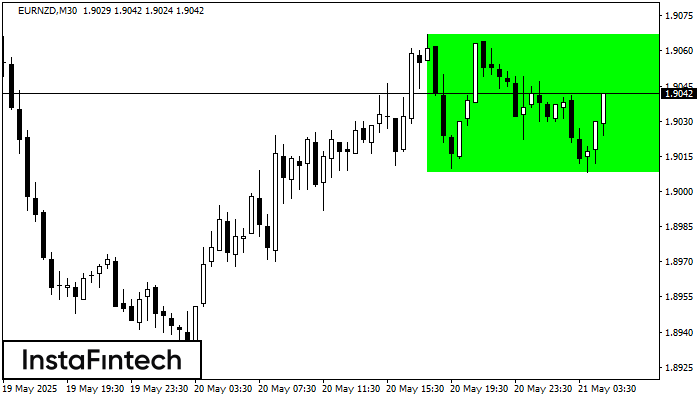
Según el gráfico de M30, EURNZD formó el Rectángulo Alcista que es un patrón de la continuación de una tendencia. El patrón está contenido dentro de los siguientes límites
Open chart in a new window


