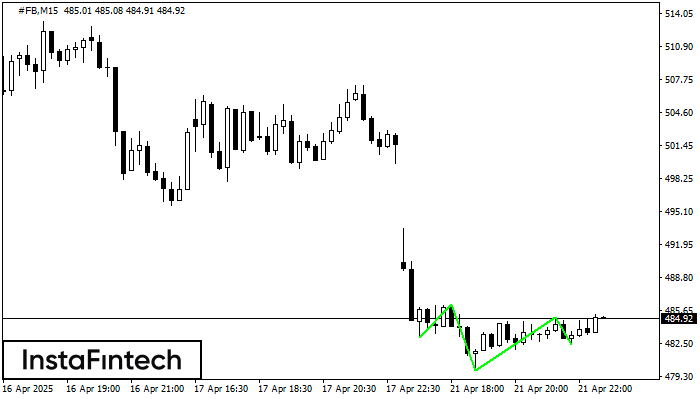
Inverse Head and Shoulder
was formed on 21.04 at 21:45:32 (UTC+0)
signal strength 2 of 5

According to the chart of M15, #FB formed the Inverse Head and Shoulder pattern. The Head’s top is set at 485.03 while the median line of the Neck is found at 479.95/482.45. The formation of the Inverse Head and Shoulder pattern evidently signals a reversal of the downward trend. In other words, in case the scenario comes true, the price of #FB will go towards 485.26
The M5 and M15 time frames may have more false entry points.
- All
- All
- Bearish Rectangle
- Bearish Symmetrical Triangle
- Bearish Symmetrical Triangle
- Bullish Rectangle
- Double Top
- Double Top
- Triple Bottom
- Triple Bottom
- Triple Top
- Triple Top
- All
- All
- Buy
- Sale
- All
- 1
- 2
- 3
- 4
- 5
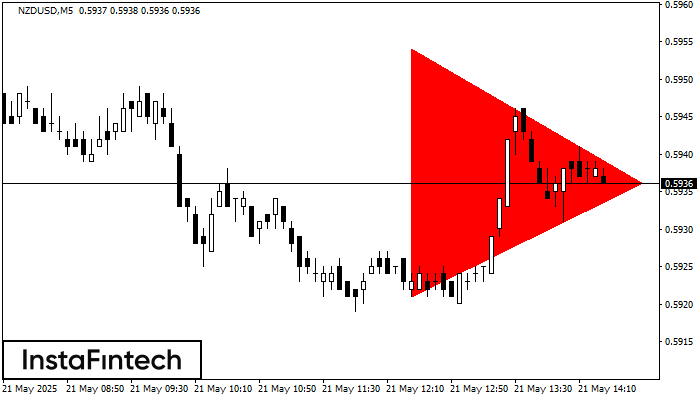
Bearish Symmetrical Triangle
was formed on 21.05 at 13:26:16 (UTC+0)
signal strength 1 of 5
According to the chart of M5, NZDUSD formed the Bearish Symmetrical Triangle pattern. This pattern signals a further downward trend in case the lower border 0.5921 is breached. Here
The M5 and M15 time frames may have more false entry points.
Open chart in a new window
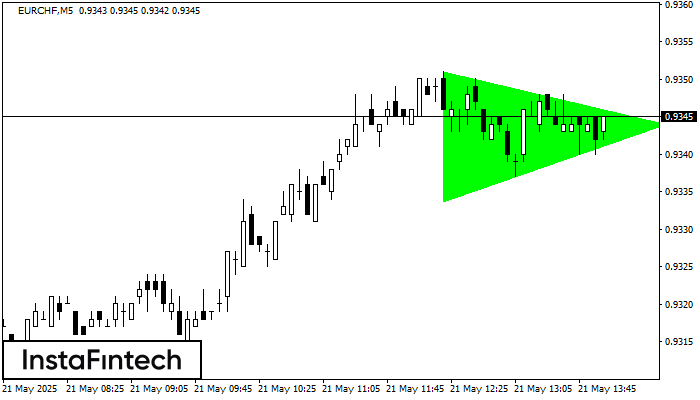
Bullish Symmetrical Triangle
was formed on 21.05 at 13:01:22 (UTC+0)
signal strength 1 of 5
According to the chart of M5, EURCHF formed the Bullish Symmetrical Triangle pattern. The lower border of the pattern touches the coordinates 0.9334/0.9344 whereas the upper border goes across 0.9351/0.9344
The M5 and M15 time frames may have more false entry points.
Open chart in a new window
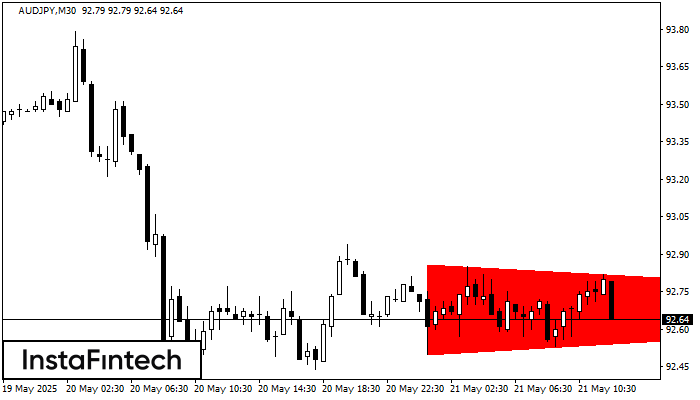
Bearish Symmetrical Triangle
was formed on 21.05 at 11:46:23 (UTC+0)
signal strength 3 of 5
According to the chart of M30, AUDJPY formed the Bearish Symmetrical Triangle pattern. This pattern signals a further downward trend in case the lower border 92.50 is breached. Here
Open chart in a new window


