

Actual patterns

Patterns are graphical models which are formed in the chart by the price. According to one of the technical analysis postulates, history (price movement) repeats itself. It means that the price movements are often similar in the same situations which makes it possible to predict the further development of the situation with a high probability.
Relevant patterns by InstaTrade is an easy-to-use service which allows you to be aware of latest changes in the market and react to clues from the market in time. In our service you will always find the latest and most relevant patterns on any pair and any timeframe.
Double Bottom
was formed on 21.04 at 21:15:26 (UTC+0)
signal strength 1 of 5
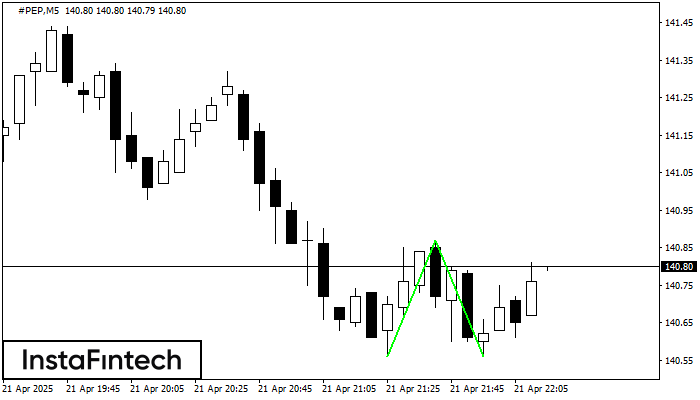
The Double Bottom pattern has been formed on #PEP M5. Characteristics: the support level 140.56; the resistance level 140.87; the width of the pattern 31 points. If the resistance level is broken, a change in the trend can be predicted with the first target point lying at the distance of 31 points.
The M5 and M15 time frames may have more false entry points.
- All
- All
- Bearish Rectangle
- Bearish Symmetrical Triangle
- Bearish Symmetrical Triangle
- Bullish Rectangle
- Double Top
- Double Top
- Triple Bottom
- Triple Bottom
- Triple Top
- Triple Top
- All
- All
- Buy
- Sale
- All
- 1
- 2
- 3
- 4
- 5
Double Bottom
was formed on 23.05 at 12:59:46 (UTC+0)
signal strength 2 of 5
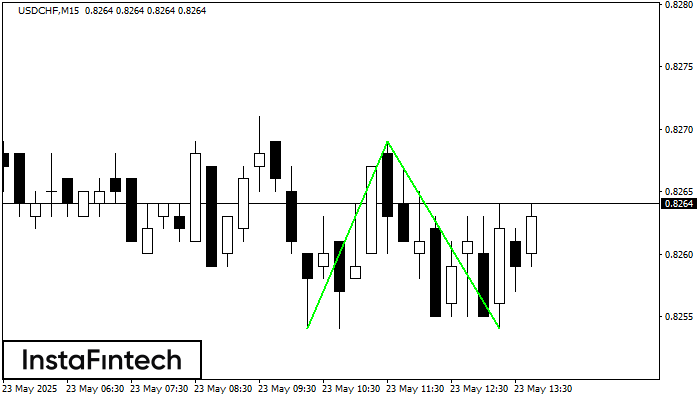
The Double Bottom pattern has been formed on USDCHF M15. Characteristics: the support level 0.8254; the resistance level 0.8269; the width of the pattern 15 points. If the resistance level
The M5 and M15 time frames may have more false entry points.
Open chart in a new window
Bullish Rectangle
was formed on 23.05 at 12:51:48 (UTC+0)
signal strength 2 of 5
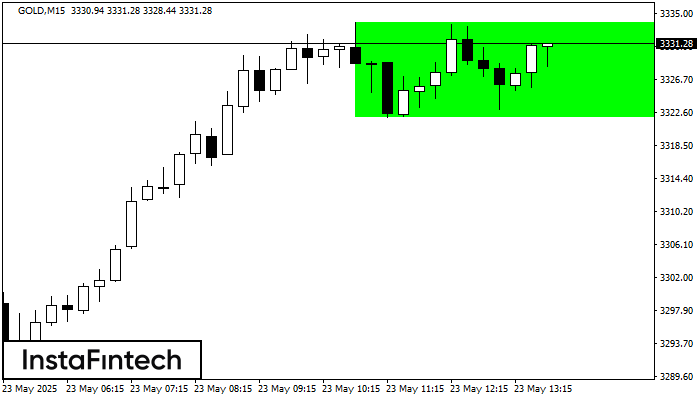
According to the chart of M15, GOLD formed the Bullish Rectangle which is a pattern of a trend continuation. The pattern is contained within the following borders: the lower border
The M5 and M15 time frames may have more false entry points.
Open chart in a new window
Bullish pennant
was formed on 23.05 at 12:40:29 (UTC+0)
signal strength 3 of 5
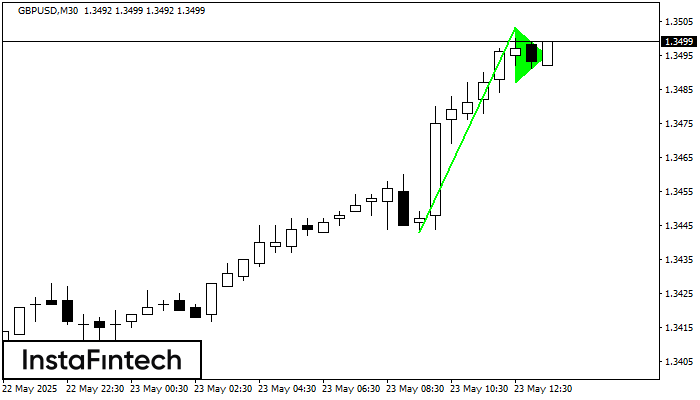
The Bullish pennant signal – Trading instrument GBPUSD M30, continuation pattern. Forecast: it is possible to set up a buy position above the pattern’s high of 1.3503, with the prospect
Open chart in a new window


