

Actual patterns

Patterns are graphical models which are formed in the chart by the price. According to one of the technical analysis postulates, history (price movement) repeats itself. It means that the price movements are often similar in the same situations which makes it possible to predict the further development of the situation with a high probability.
Relevant patterns by InstaTrade is an easy-to-use service which allows you to be aware of latest changes in the market and react to clues from the market in time. In our service you will always find the latest and most relevant patterns on any pair and any timeframe.
Bearish Flag
was formed on 21.04 at 03:52:15 (UTC+0)
signal strength 2 of 5

The Bearish Flag pattern has been formed on USDJPY at M15. The lower boundary of the pattern is located at 140.89/141.19 while the upper boundary lies at 141.19/141.49. The projection of the flagpole is 77 points. This formation signals that the downward trend is most likely to continue. Therefore, if the level of 140.89 is broken, the price will move further downwards.
The M5 and M15 time frames may have more false entry points.
- All
- All
- Bearish Rectangle
- Bearish Symmetrical Triangle
- Bearish Symmetrical Triangle
- Bullish Rectangle
- Double Top
- Double Top
- Triple Bottom
- Triple Bottom
- Triple Top
- Triple Top
- All
- All
- Buy
- Sale
- All
- 1
- 2
- 3
- 4
- 5
Head dan Shoulders
was formed on 22.05 at 17:00:26 (UTC+0)
signal strength 4 of 5
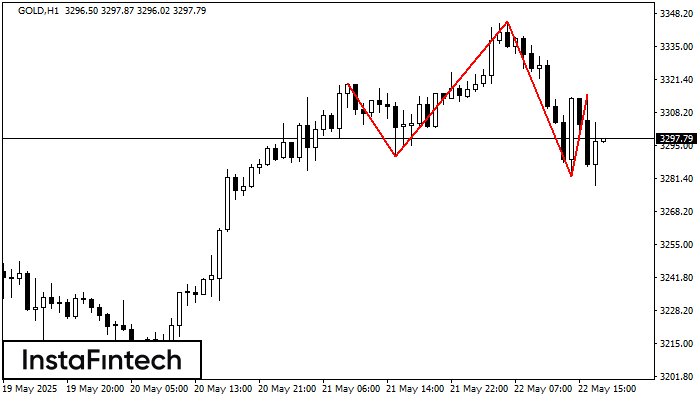
GOLD H1 membentuk corak Head dan Shoulders dengan ciri-ciri berikut: Bahagian atas Head adalah 3344.99, garisan Neck dan sudut menaik berada pada 3290.48/3282.56. Pembentukan corak ini boleh membawa perubahan dalam
Open chart in a new window
Segi Tiga Simetri Menurun
was formed on 22.05 at 16:50:59 (UTC+0)
signal strength 1 of 5
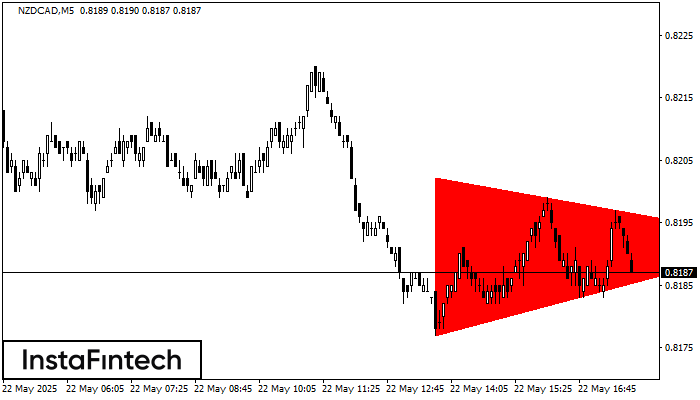
Berdasarkan carta M5, NZDCAD membentuk corak Segi Tiga Simetri Menurun. Penerangan: Sempadan yang lebih rendah ialah 0.8177/0.8192 dan sempadan atas adalah 0.8202/0.8192. Lebar corak diukur pada carta pada -25 pips
Carta masa M5 dan M15 mungkin mempunyai lebih banyak titik kemasukan palsu.
Open chart in a new window
Triple Bottom
was formed on 22.05 at 16:50:25 (UTC+0)
signal strength 1 of 5
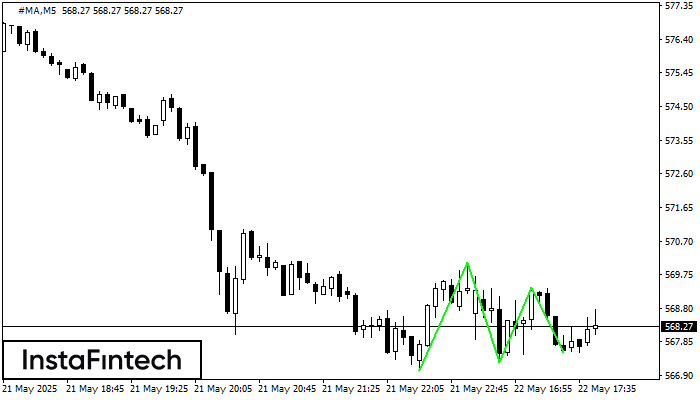
Corak Triple Bottom telah dibentuk pada #MA M5. Ia mempunyai ciri-ciri berikut: tahap rintangan 570.10/569.39; tahap sokongan 567.05/567.54; lebar corak adalah 305 mata. Dalam situasi penembusan paras rintangan 570.10, harga
Carta masa M5 dan M15 mungkin mempunyai lebih banyak titik kemasukan palsu.
Open chart in a new window


