

Actual patterns

Patterns are graphical models which are formed in the chart by the price. According to one of the technical analysis postulates, history (price movement) repeats itself. It means that the price movements are often similar in the same situations which makes it possible to predict the further development of the situation with a high probability.
Relevant patterns by InstaTrade is an easy-to-use service which allows you to be aware of latest changes in the market and react to clues from the market in time. In our service you will always find the latest and most relevant patterns on any pair and any timeframe.
Double Bottom
was formed on 18.04 at 11:00:39 (UTC+0)
signal strength 2 of 5
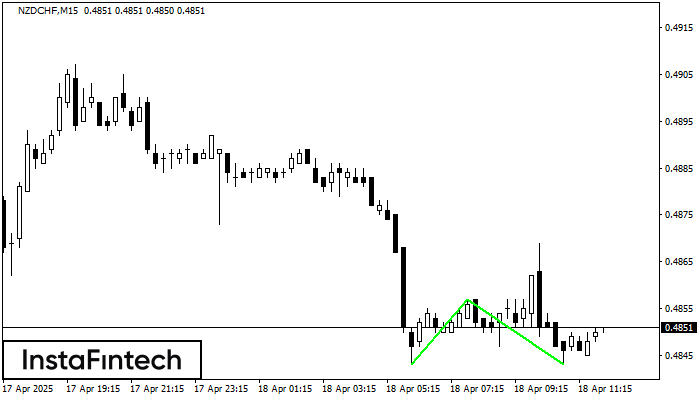
The Double Bottom pattern has been formed on NZDCHF M15. This formation signals a reversal of the trend from downwards to upwards. The signal is that a buy trade should be opened after the upper boundary of the pattern 0.4857 is broken. The further movements will rely on the width of the current pattern 14 points.
The M5 and M15 time frames may have more false entry points.
See Also
- All
- All
- Bearish Rectangle
- Bearish Symmetrical Triangle
- Bearish Symmetrical Triangle
- Bullish Rectangle
- Double Top
- Double Top
- Triple Bottom
- Triple Bottom
- Triple Top
- Triple Top
- All
- All
- Buy
- Sale
- All
- 1
- 2
- 3
- 4
- 5
Doble Piso
was formed on 22.05 at 10:30:10 (UTC+0)
signal strength 3 of 5
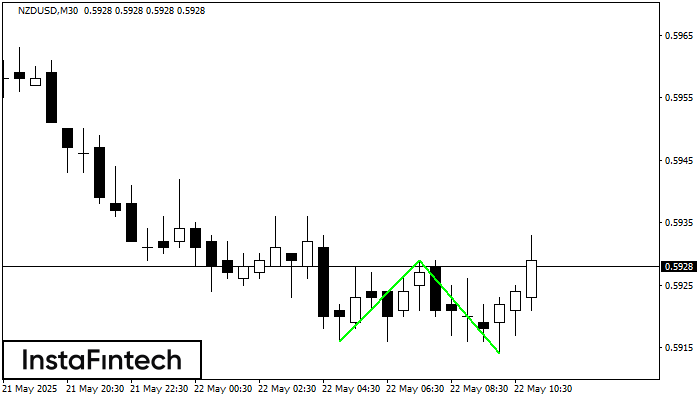
El patrón Doble Piso ha sido formado en NZDUSD M30. Características: el nivel de soporte 0.5916; el nivel de resistencia 0.5929; el ancho del patrón 13 puntos. Si el nivel
Open chart in a new window
Doble Piso
was formed on 22.05 at 10:30:07 (UTC+0)
signal strength 2 of 5
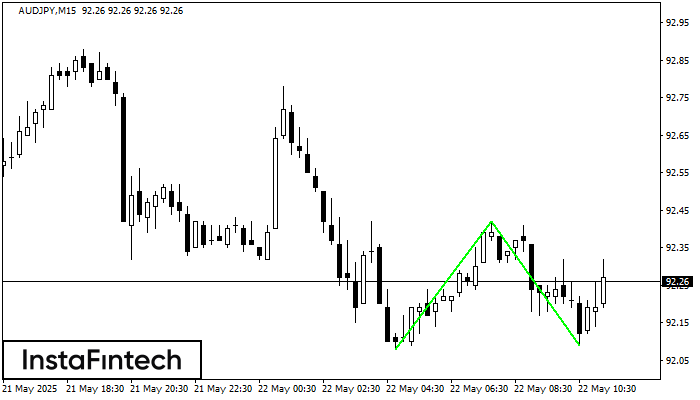
El patrón Doble Piso ha sido formado en AUDJPY M15. Características: el nivel de soporte 92.08; el nivel de resistencia 92.42; el ancho del patrón 34 puntos. Si el nivel
Los marcos de tiempo M5 y M15 pueden tener más puntos de entrada falsos.
Open chart in a new window
Doble Piso
was formed on 22.05 at 10:25:09 (UTC+0)
signal strength 1 of 5
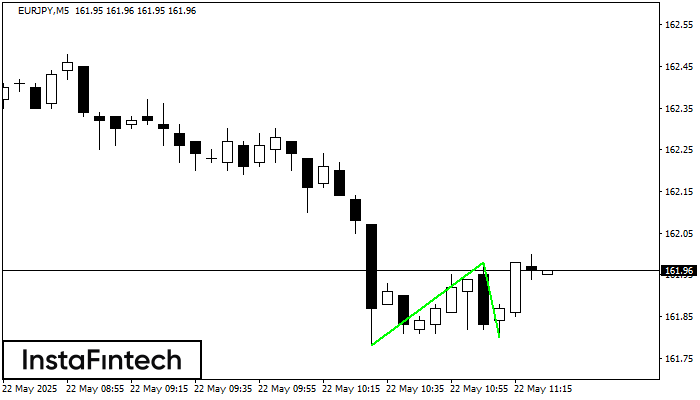
El patrón Doble Piso ha sido formado en EURJPY M5. Características: el nivel de soporte 161.78; el nivel de resistencia 161.98; el ancho del patrón 20 puntos. Si el nivel
Los marcos de tiempo M5 y M15 pueden tener más puntos de entrada falsos.
Open chart in a new window


