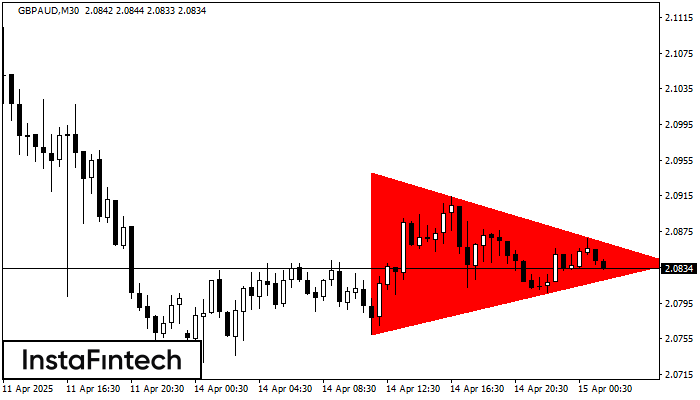
Bearish Symmetrical Triangle
was formed on 15.04 at 01:05:33 (UTC+0)
signal strength 3 of 5

According to the chart of M30, GBPAUD formed the Bearish Symmetrical Triangle pattern. This pattern signals a further downward trend in case the lower border 2.0760 is breached. Here, a hypothetical profit will equal the width of the available pattern that is -182 pips.
- All
- All
- Bearish Rectangle
- Bearish Symmetrical Triangle
- Bearish Symmetrical Triangle
- Bullish Rectangle
- Double Top
- Double Top
- Triple Bottom
- Triple Bottom
- Triple Top
- Triple Top
- All
- All
- Buy
- Sale
- All
- 1
- 2
- 3
- 4
- 5
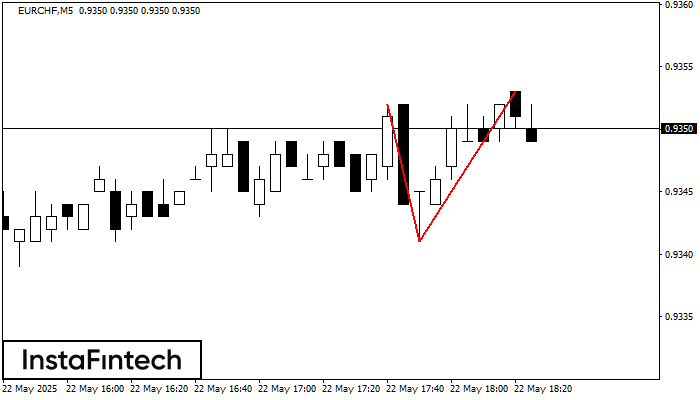
Doble Techo
was formed on 22.05 at 17:30:27 (UTC+0)
signal strength 1 of 5
El patrón de reversión Doble Techo ha sido formado en EURCHF M5. Características: el límite superior 0.9352; el límite inferior 0.9341; el ancho del patrón es 12 puntos. Es mejor
Los marcos de tiempo M5 y M15 pueden tener más puntos de entrada falsos.
Open chart in a new window
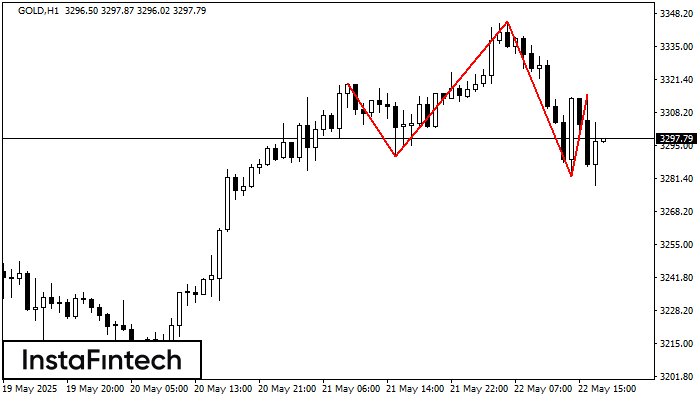
Cabeza y Hombros
was formed on 22.05 at 17:00:26 (UTC+0)
signal strength 4 of 5
El GOLD H1 formó el patrón Cabeza y Hombros con las siguientes características: El techo de la Cabeza se encuentra en 3344.99, la línea de cuello y el ángulo alcista
Open chart in a new window
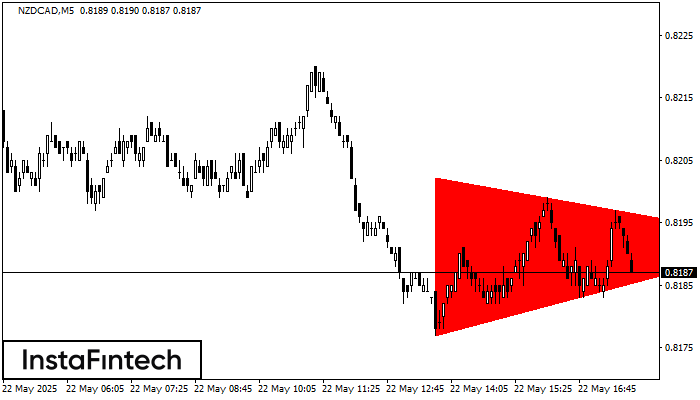
Triángulo Simétrico Bajista
was formed on 22.05 at 16:50:59 (UTC+0)
signal strength 1 of 5
Según el gráfico de M5, el NZDCAD formó el patrón Triángulo Simétrico Bajista. Descripción: El límite inferior es 0.8177/0.8192 y el límite superior es 0.8202/0.8192. El ancho del patrón
Los marcos de tiempo M5 y M15 pueden tener más puntos de entrada falsos.
Open chart in a new window


