

Actual patterns

Patterns are graphical models which are formed in the chart by the price. According to one of the technical analysis postulates, history (price movement) repeats itself. It means that the price movements are often similar in the same situations which makes it possible to predict the further development of the situation with a high probability.
Relevant patterns by InstaTrade is an easy-to-use service which allows you to be aware of latest changes in the market and react to clues from the market in time. In our service you will always find the latest and most relevant patterns on any pair and any timeframe.
Double Top
was formed on 14.04 at 10:15:57 (UTC+0)
signal strength 1 of 5
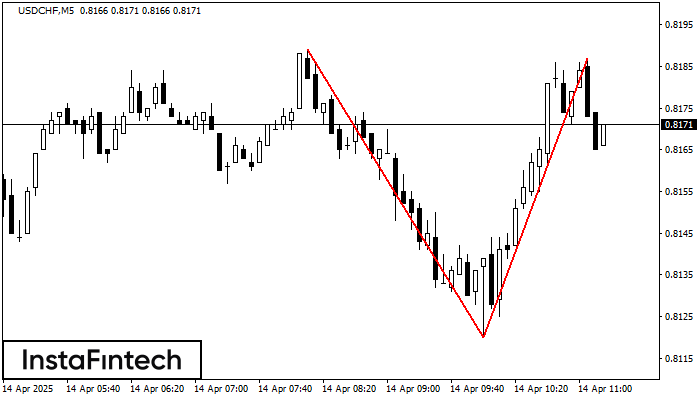
The Double Top reversal pattern has been formed on USDCHF M5. Characteristics: the upper boundary 0.8189; the lower boundary 0.8120; the width of the pattern is 67 points. Sell trades are better to be opened below the lower boundary 0.8120 with a possible movements towards the 0.8105 level.
The M5 and M15 time frames may have more false entry points.
- All
- All
- Bearish Rectangle
- Bearish Symmetrical Triangle
- Bearish Symmetrical Triangle
- Bullish Rectangle
- Double Top
- Double Top
- Triple Bottom
- Triple Bottom
- Triple Top
- Triple Top
- All
- All
- Buy
- Sale
- All
- 1
- 2
- 3
- 4
- 5
Rectángulo Alcista
was formed on 23.05 at 06:32:41 (UTC+0)
signal strength 1 of 5
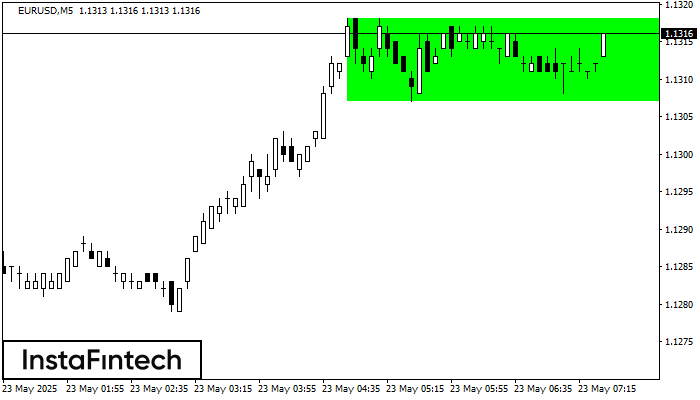
Según el gráfico de M5, EURUSD formó el Rectángulo Alcista. Este tipo de patrón indica la continuación de una tendencia. Esto consiste de dos niveles: resistencia 1.1318 y soporte 1.1307
Los marcos de tiempo M5 y M15 pueden tener más puntos de entrada falsos.
Open chart in a new window
Doble Techo
was formed on 23.05 at 06:04:11 (UTC+0)
signal strength 3 of 5
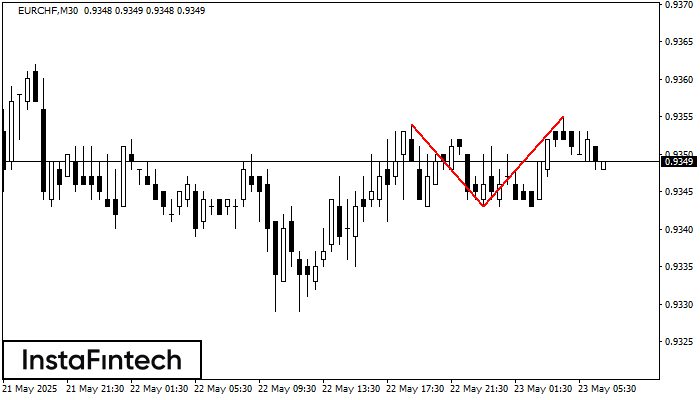
El patrón Doble Techo ha sido formado en EURCHF M30. Esto señala que la tendencia ha sido cambiada de alcista a bajista. Probablemente, si la base del patrón 0.9343
Open chart in a new window
Triple Techo
was formed on 23.05 at 06:00:18 (UTC+0)
signal strength 4 of 5
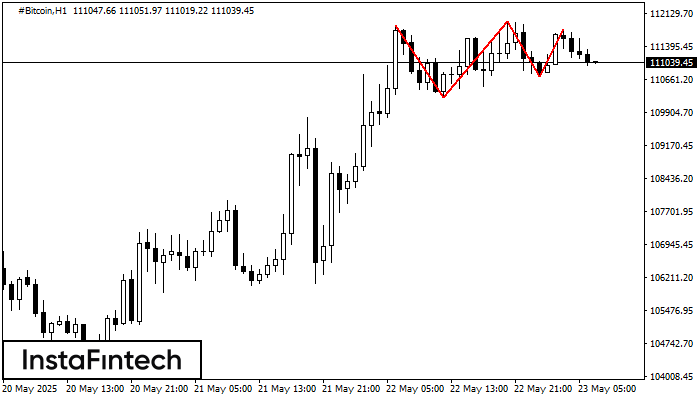
El patrón Triple Techo ha sido formado en el gráfico de #Bitcoin H1. Características del patrón: los límites tienen un ángulo ascendente, la línea inferior del patrón tiene coordenadas 110239.46/110716.22
Open chart in a new window


