

Actual patterns

Patterns are graphical models which are formed in the chart by the price. According to one of the technical analysis postulates, history (price movement) repeats itself. It means that the price movements are often similar in the same situations which makes it possible to predict the further development of the situation with a high probability.
Relevant patterns by InstaTrade is an easy-to-use service which allows you to be aware of latest changes in the market and react to clues from the market in time. In our service you will always find the latest and most relevant patterns on any pair and any timeframe.
Bullish Symmetrical Triangle
was formed on 04.04 at 18:40:34 (UTC+0)
signal strength 1 of 5
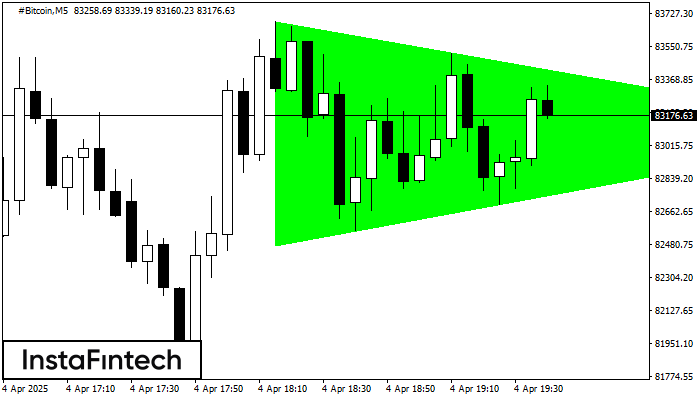
According to the chart of M5, #Bitcoin formed the Bullish Symmetrical Triangle pattern, which signals the trend will continue. Description. The upper border of the pattern touches the coordinates 83683.03/83088.93 whereas the lower border goes across 82478.14/83088.93. The pattern width is measured on the chart at 120489 pips. If the Bullish Symmetrical Triangle pattern is in progress during the upward trend, this indicates the current trend will go on. In case 83088.93 is broken, the price could continue its move toward 83089.08.
The M5 and M15 time frames may have more false entry points.
- All
- All
- Bearish Rectangle
- Bearish Symmetrical Triangle
- Bearish Symmetrical Triangle
- Bullish Rectangle
- Double Top
- Double Top
- Triple Bottom
- Triple Bottom
- Triple Top
- Triple Top
- All
- All
- Buy
- Sale
- All
- 1
- 2
- 3
- 4
- 5
Bearish pennant
was formed on 23.05 at 19:22:47 (UTC+0)
signal strength 3 of 5
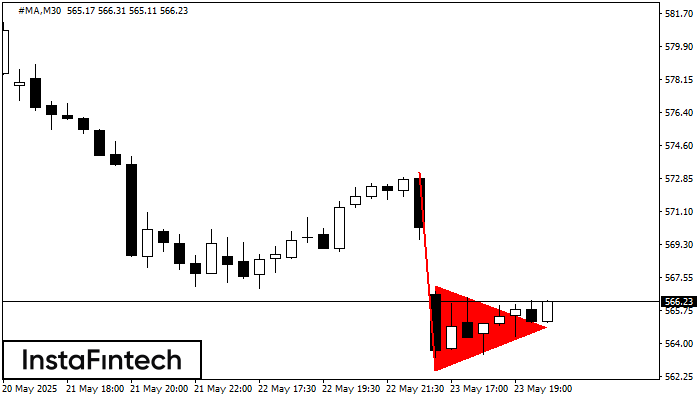
The Bearish pennant pattern has formed on the #MA M30 chart. This pattern type is characterized by a slight slowdown after which the price will move in the direction
Open chart in a new window
Double Top
was formed on 23.05 at 19:20:48 (UTC+0)
signal strength 1 of 5
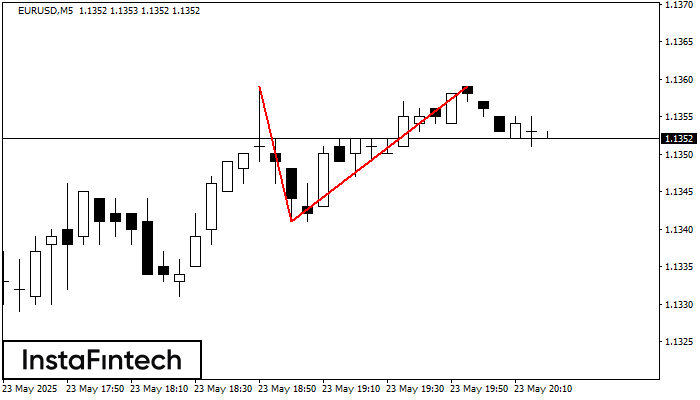
The Double Top reversal pattern has been formed on EURUSD M5. Characteristics: the upper boundary 1.1359; the lower boundary 1.1341; the width of the pattern is 18 points. Sell trades
The M5 and M15 time frames may have more false entry points.
Open chart in a new window
Double Top
was formed on 23.05 at 19:00:11 (UTC+0)
signal strength 1 of 5
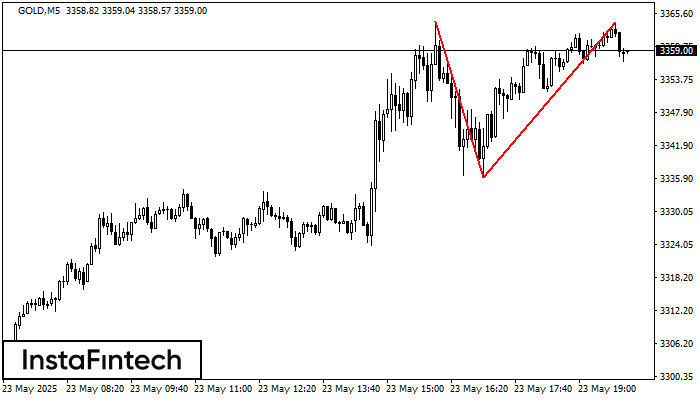
On the chart of GOLD M5 the Double Top reversal pattern has been formed. Characteristics: the upper boundary 3364.14; the lower boundary 3336.09; the width of the pattern 2805 points
The M5 and M15 time frames may have more false entry points.
Open chart in a new window


