

Actual patterns

Patterns are graphical models which are formed in the chart by the price. According to one of the technical analysis postulates, history (price movement) repeats itself. It means that the price movements are often similar in the same situations which makes it possible to predict the further development of the situation with a high probability.
Relevant patterns by InstaTrade is an easy-to-use service which allows you to be aware of latest changes in the market and react to clues from the market in time. In our service you will always find the latest and most relevant patterns on any pair and any timeframe.
Bearish Rectangle
was formed on 27.03 at 06:07:54 (UTC+0)
signal strength 1 of 5

According to the chart of M5, USDJPY formed the Bearish Rectangle. The pattern indicates a trend continuation. The upper border is 150.29, the lower border is 150.10. The signal means that a short position should be opened after fixing a price below the lower border 150.10 of the Bearish Rectangle.
The M5 and M15 time frames may have more false entry points.
See Also
- All
- All
- Bearish Rectangle
- Bearish Symmetrical Triangle
- Bearish Symmetrical Triangle
- Bullish Rectangle
- Double Top
- Double Top
- Triple Bottom
- Triple Bottom
- Triple Top
- Triple Top
- All
- All
- Buy
- Sale
- All
- 1
- 2
- 3
- 4
- 5
Бычий симметричный треугольник
сформирован 23.05 в 04:58:44 (UTC+0)
сила сигнала 1 из 5
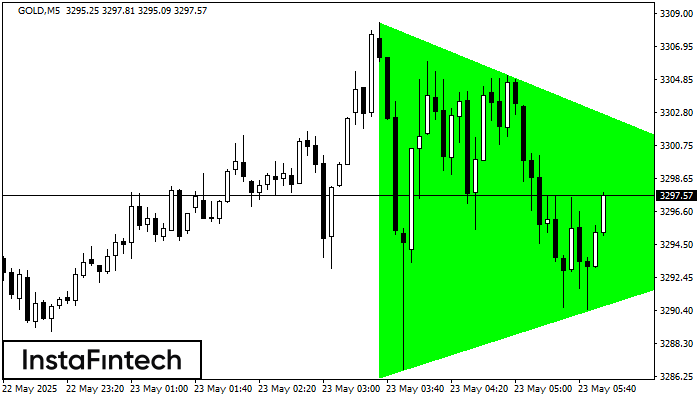
По GOLD на M5 сформировалась фигура «Бычий симметричный треугольник». Нижняя граница фигуры имеет координаты 3286.21/3295.95, при этом верхняя граница 3308.46/3295.95. Формирование фигуры «Бычий симметричный треугольник» наиболее вероятным образом свидетельствует
Таймфреймы М5 и М15 могут иметь больше ложных точек входа.
Открыть график инструмента в новом окне
Медвежий симметричный треугольник
сформирован 23.05 в 04:35:13 (UTC+0)
сила сигнала 3 из 5
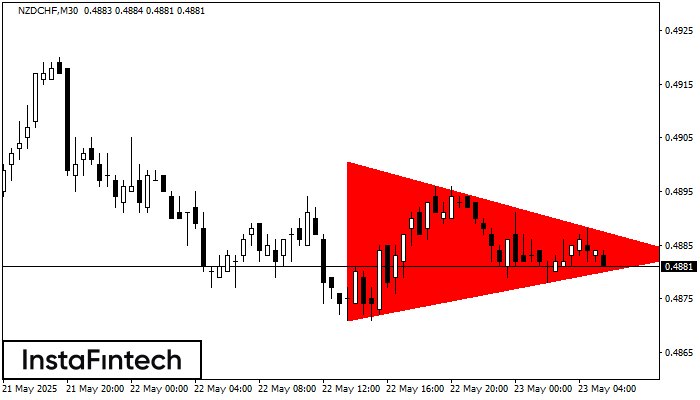
На графике NZDCHF на M30 сформировалась фигура «Медвежий симметричный треугольник». Торговые рекомендации: Пробой нижней границы 0.4871 с большой долей вероятности приведет к продолжению нисходящего тренда
Открыть график инструмента в новом окне
Медвежий симметричный треугольник
сформирован 23.05 в 04:34:52 (UTC+0)
сила сигнала 3 из 5
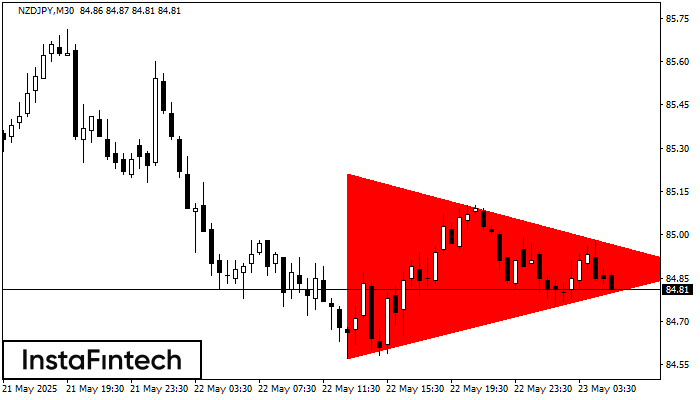
На графике NZDJPY на M30 сформировалась фигура «Медвежий симметричный треугольник». Торговые рекомендации: Пробой нижней границы 84.57 с большой долей вероятности приведет к продолжению нисходящего тренда
Открыть график инструмента в новом окне


